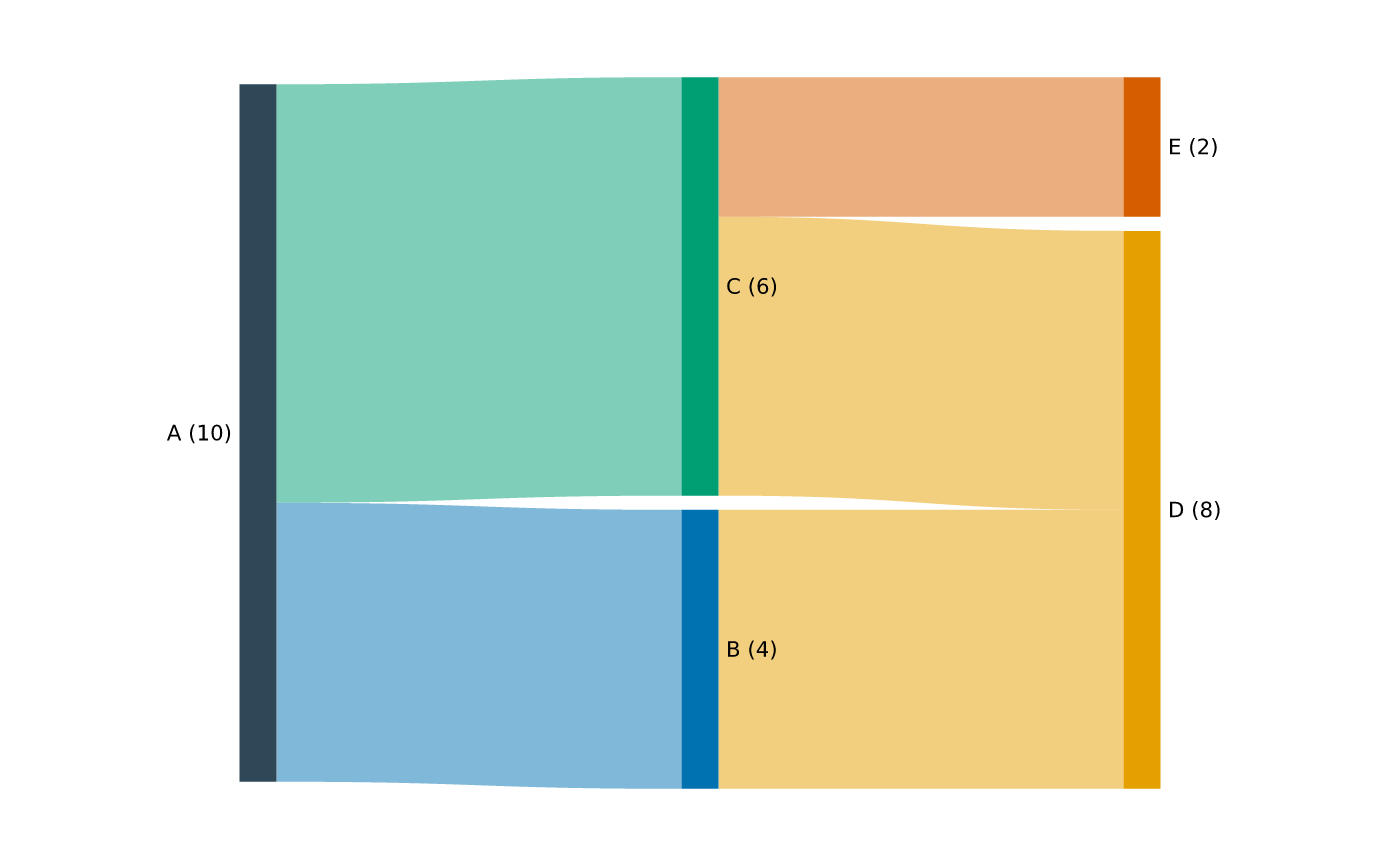
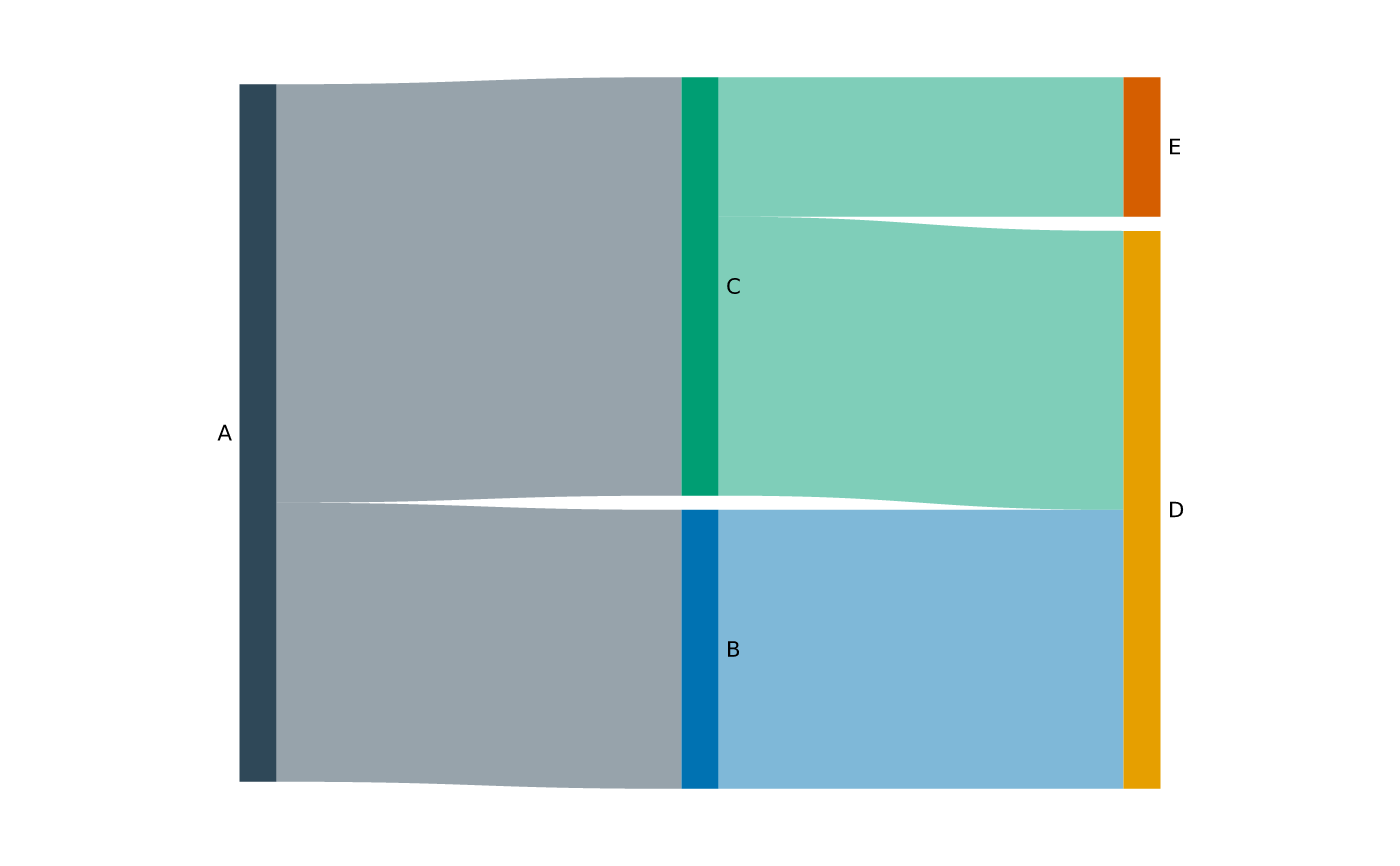
vsankey() draws a layered flow diagram from a flow list — one row per
flow with a from node, a to node, and a value (the ribbon width). Nodes
are the union of from/to; a node that is both a source and a target makes
the diagram multi-stage. Like vgraph(), it returns a ready PlotSpec with an
axis-free, aspect-free panel; mark_sankey() is the layer it adds and can be
used directly on a plot you have set up yourself.
Usage
vsankey(
  data,
  from,
  to,
  value,
  label = TRUE,
  show_values = FALSE,
  flow_color = "source",
  node_width = 0.04,
  node_gap = 0.02,
  width = 8,
  height = 5,
  dpi = 96
)

mark_sankey(
  plot,
  from,
  to,
  value,
  label = TRUE,
  show_values = FALSE,
  flow_color = "source",
  node_width = 0.04,
  node_gap = 0.02
)
Arguments
- data
A data frame of flows.
- from, to, value
Columns (tidy-eval): the source node, target node, and flow value.
- label
Draw node labels? Default
TRUE.- show_values
Append each node's value to its label (e.g.
"Grid (60)")? DefaultFALSE. Ignored whenlabel = FALSE.- flow_color
Ribbon fill:
"source"(default) colours each ribbon by its source node,"target"by its target node, and"gradient"fades each ribbon from its source colour to its target colour.- node_width
Node-rectangle width, as a fraction of the plotting width (default
0.04).- node_gap
Vertical gap between the nodes in a column, as a fraction of the column height (default
0.02).- width, height, dpi
Page size (inches) and resolution.
- plot
A PlotSpec.
Value
A PlotSpec (vsankey()) or the modified plot (mark_sankey()).
Details
The flows must form a DAG (no cycles). Nodes within a column are ordered to minimise ribbon crossings (a deterministic Sugiyama barycenter sweep), and ribbons are stacked to meet each node in matching order. Nodes are coloured from the built-in qualitative palette.
Examples
flows <- data.frame(
from = c("A", "A", "B", "C", "C"),
to = c("B", "C", "D", "D", "E"),
value = c(4, 6, 4, 4, 2)
)
vsankey(flows, from, to, value)
 vsankey(flows, from, to, value, show_values = TRUE, flow_color = "target")