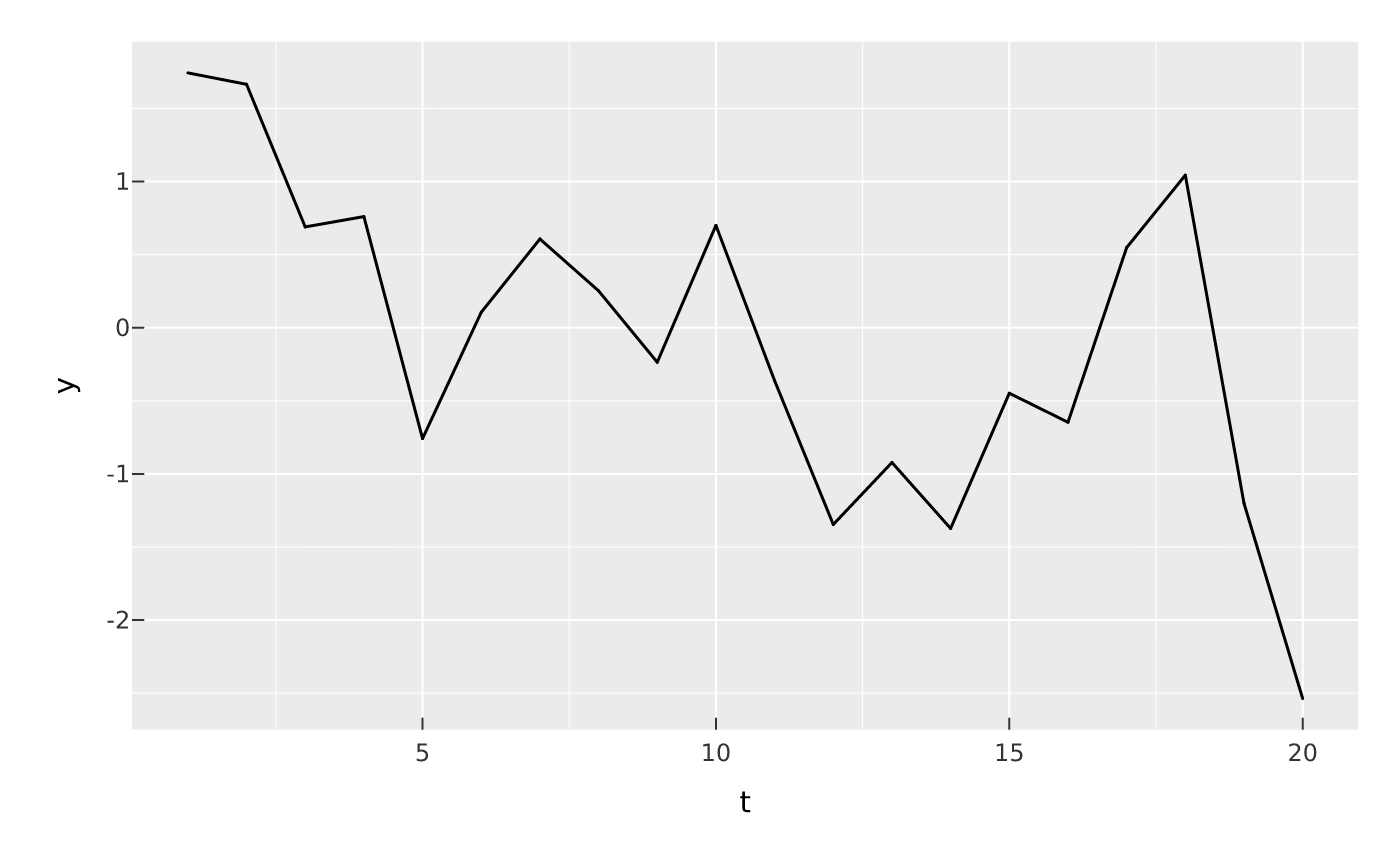
transition_reveal() wipes the plot into view left to right — the classic
"line draws itself" animation. Unlike transition_states(), it does not tween
between states: the full plot is compiled and a clip rectangle grows across the
panel, revealing the marks in along order. Best for a line or path over a
continuous along (typically the x variable, e.g. time).
Value
The modified PlotSpec.
Examples
vplot(data.frame(t = 1:20, y = cumsum(rnorm(20)))) |>
  mark_line(x = t, y = y) |>
  transition_reveal(t)