
A selection is a named set of data elements defined by a user gesture. On
its own it does nothing visible; refer to it from condition() (style by
membership), filter_by() (show only members), or bind_scale() (drive
another panel's view). Selections are part of the plot spec, so they travel
with it, serialise with it, and are enacted by any capable host
(vellumwidget). They are inert on a static render.
Arguments
- plot
A PlotSpec (piped form), or a selection name string (free-standing form).
- name
The selection name (piped form) — a string other nodes reference.
- on
The gesture. Point:
"click"(default) or"hover". Interval:"xy"(default, both axes),"x", or"y"(a single-axis brush).- fields
For a point selection, the column name(s) whose match extends membership: clicking one element selects every row equal to it on these fields (e.g.
fields = "grp"selects the whole group).NULL(default) selects only the clicked element.group_byis an alias.- group_by
Alias for
fields.- toggle
For a point selection, whether clicking toggles membership (
TRUE, default) or replaces it (FALSE, single-select).- empty
Whether an empty selection contains all elements (
TRUE, default — so an unselected plot shows its full self and selecting narrows) or none (FALSE).- region
For an interval selection,
"rect"(default, a brush rectangle) or"lasso"(a freehand polygon).
Value
A PlotSpec (piped form) or a SelectionSpec (free-standing form).
Details
select_point() is driven by a click or hover (or a legend value);
select_interval() by a drag (a brush rectangle or a lasso), optionally locked
to an axis.
Both are pipe-first (attach to the plot and return it) or free-standing
(call with the name as the first argument to get a SelectionSpec you can share
across views, then attach with add_selection()).
Examples
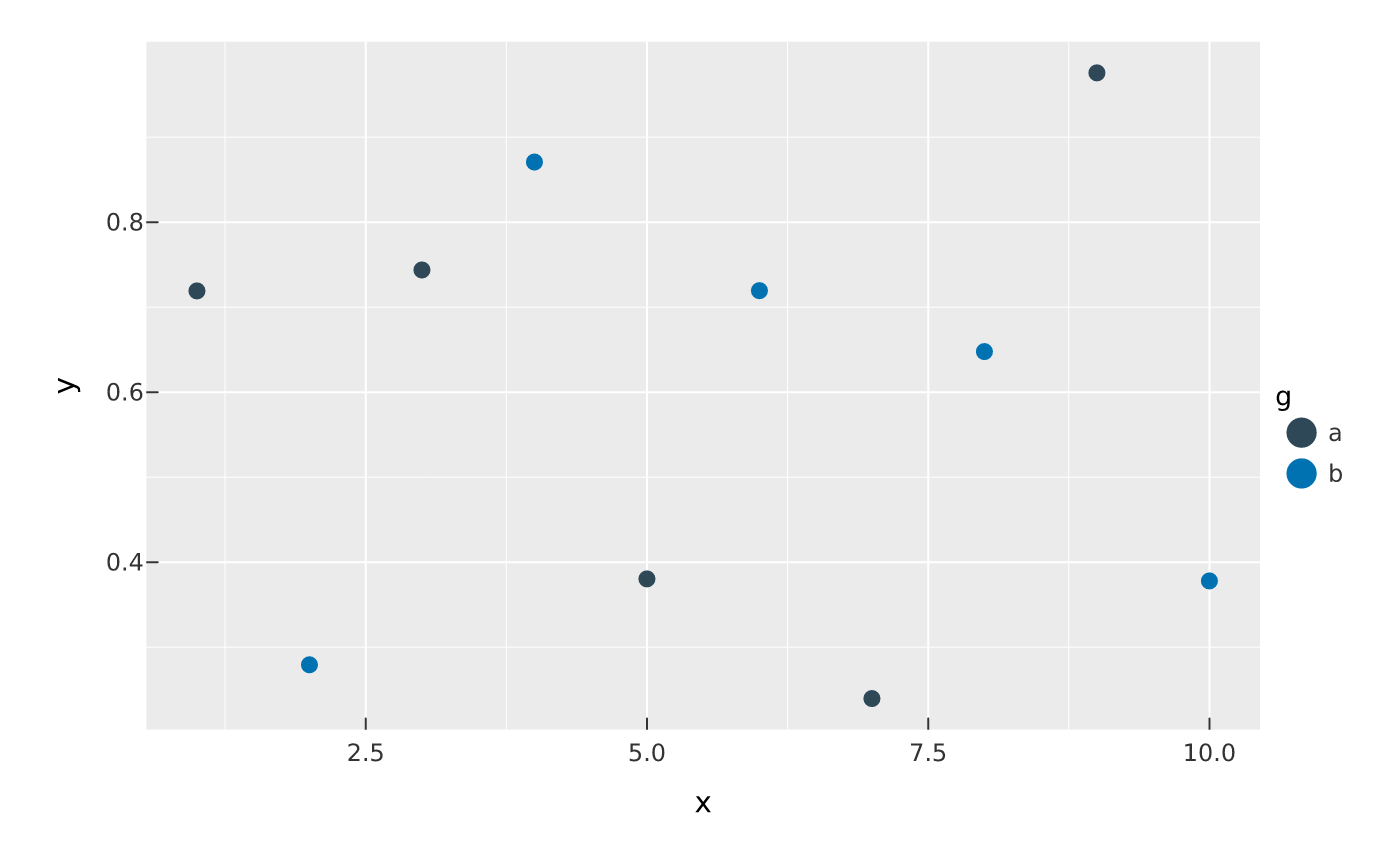
df <- data.frame(x = 1:10, y = runif(10), g = rep(c("a", "b"), 5))
# highlight on hover (piped)
vplot(df) |>
mark_point(x = x, y = y, color = condition("hi", g, "grey80")) |>
select_point("hi", on = "hover")
 # free-standing, for cross-view use
sel <- select_interval("brush", on = "x")
# free-standing, for cross-view use
sel <- select_interval("brush", on = "x")