Declare the scale for a mapped (discrete) shape aesthetic. Levels cycle
through a default set of marker shapes unless values is given. A shape legend
is drawn automatically.
Arguments
- plot
A PlotSpec.
- values
Character vector of shapes, or
NULLfor the default. Each is either a built-in marker ("circle","square","triangle","diamond","plus","cross","triangle_down","star") or an SVG icon — a pathdstring (what icon sets ship) or a path to a.svgfile. SVG values are drawn as crisp vector markers (viavellum::svg_grob()) and the legend shows the icon; thesizeaesthetic scales them.- name
Legend title, or
NULLto derive from the encoding.
Value
The modified PlotSpec.
Examples
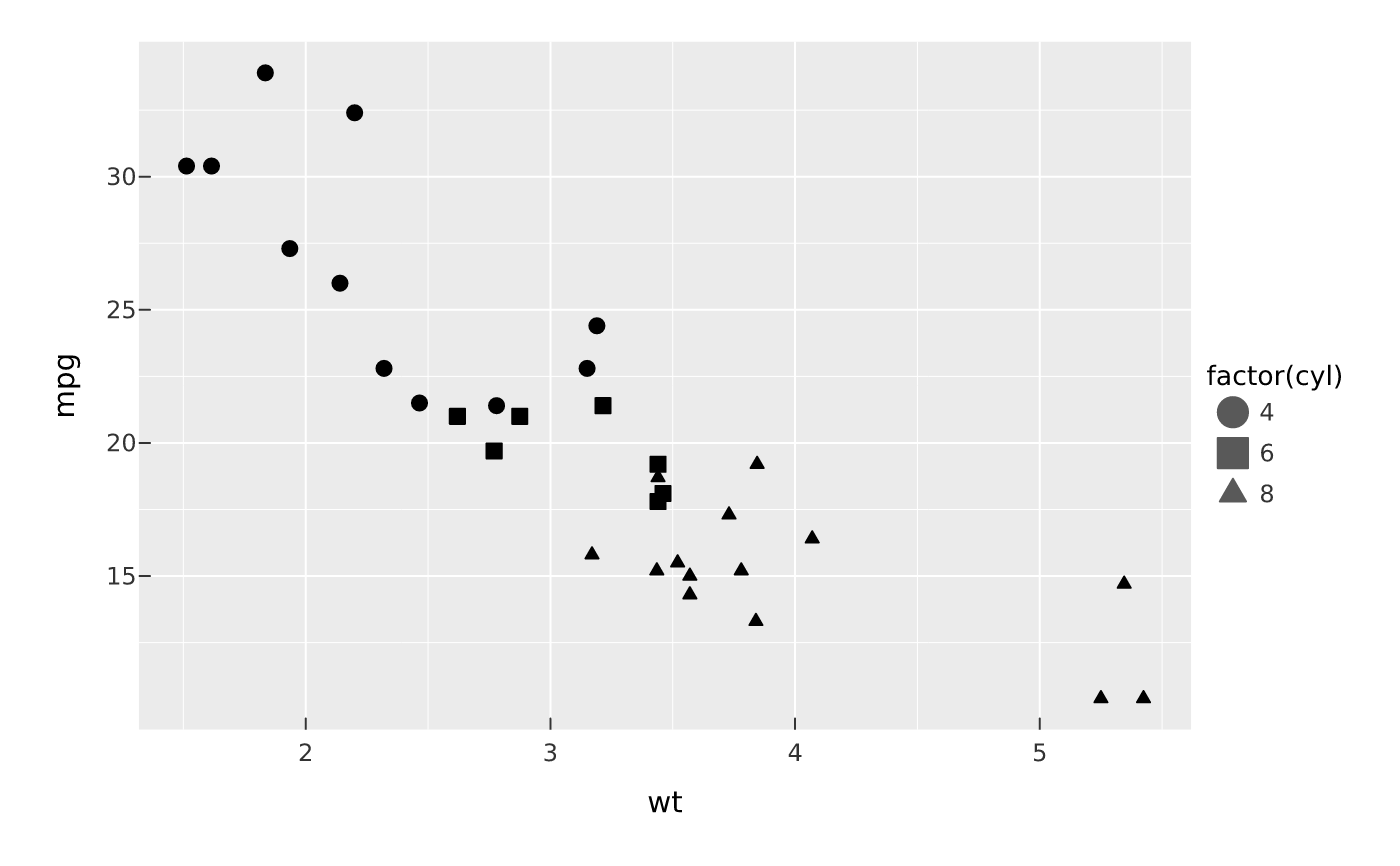
vplot(mtcars) |> mark_point(x = wt, y = mpg, shape = factor(cyl))
 # SVG icon markers, one per level:
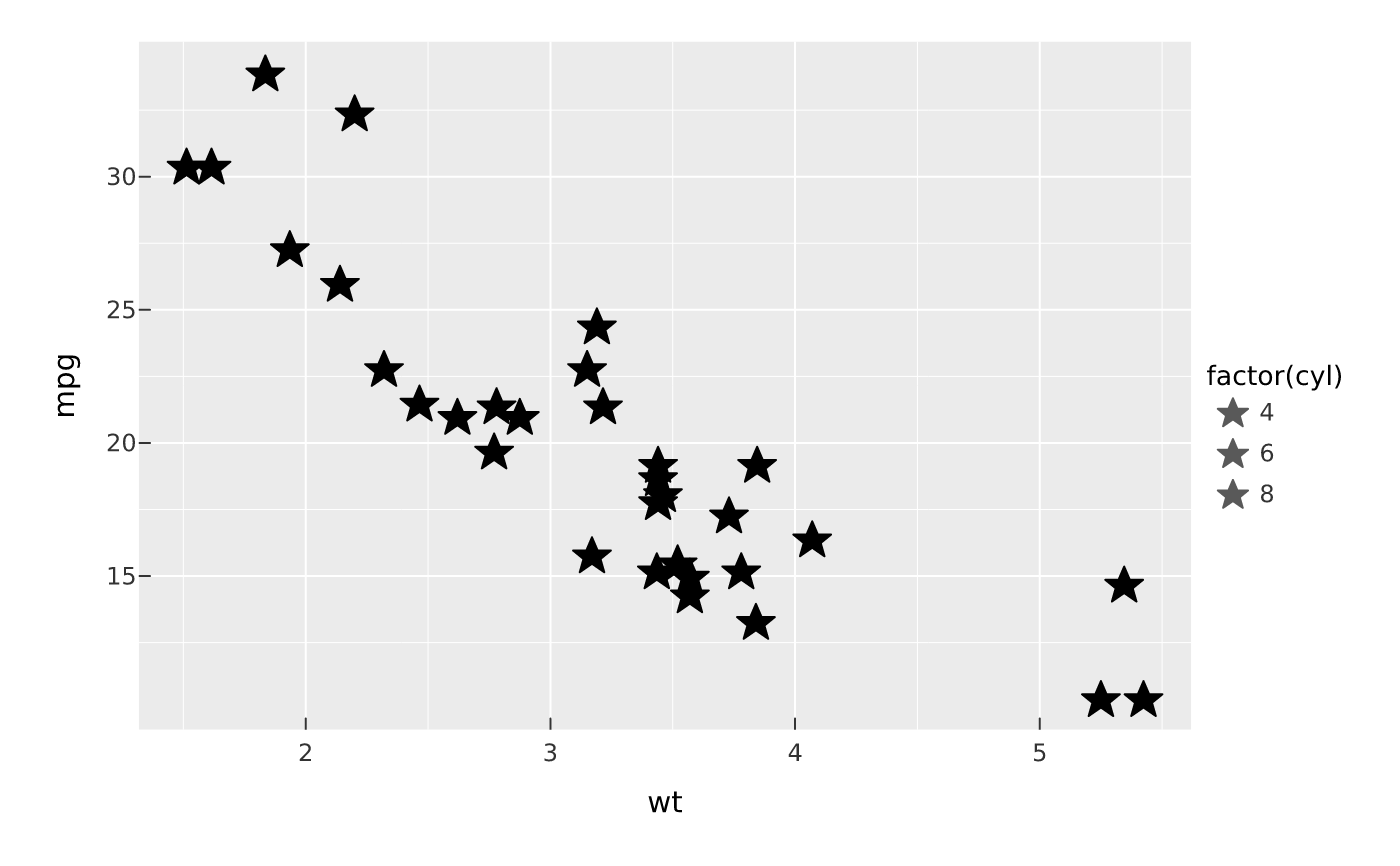
star <- "M12 2l3 7h7l-5.5 4.5 2 7-6.5-4.5-6.5 4.5 2-7L2 9h7z"
vplot(mtcars) |>
mark_point(x = wt, y = mpg, shape = factor(cyl)) |>
scale_shape(values = c(star, star, star))
# SVG icon markers, one per level:
star <- "M12 2l3 7h7l-5.5 4.5 2 7-6.5-4.5-6.5 4.5 2-7L2 9h7z"
vplot(mtcars) |>
mark_point(x = wt, y = mpg, shape = factor(cyl)) |>
scale_shape(values = c(star, star, star))