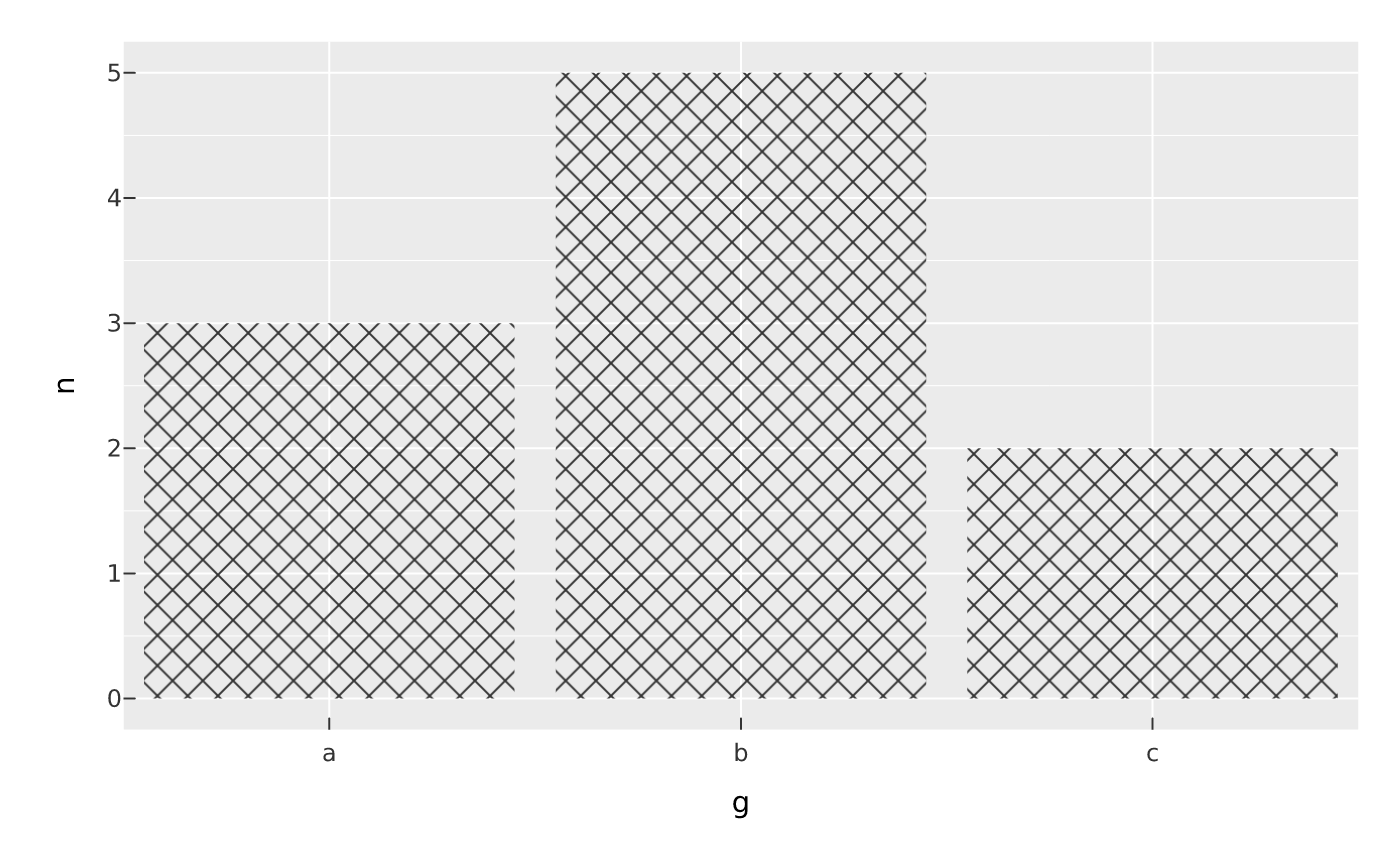
Build a tiling pattern to use as a constant fill value on a filled mark,
the texture counterpart of linear_gradient(). Distinguishing regions by
texture (not only hue) keeps a plot legible in greyscale print and under
colour-vision deficiency. Each constructor assembles a small tile and returns a
vellum_pattern (via vellum::vl_pattern()); pass it straight to fill:
Usage
pattern_stripe(
  color = "grey20",
  bg = NA,
  angle = 45,
  spacing = 4,
  linewidth = 1,
  units = "mm"
)

pattern_crosshatch(
  color = "grey20",
  bg = NA,
  angle = 45,
  spacing = 4,
  linewidth = 1,
  units = "mm"
)

pattern_grid(
  color = "grey20",
  bg = NA,
  spacing = 4,
  linewidth = 1,
  units = "mm"
)

pattern_dot(color = "grey20", bg = NA, spacing = 4, size = 1.5, units = "mm")

pattern_checker(color = "grey20", bg = NA, size = 4, units = "mm")
Arguments
- color
Line/dot colour (any R colour). Default
"grey20".- bg
Background fill painted behind the motif, or
NA(default) for a transparent tile so whatever is under the shape shows through.- angle
Stripe orientation in degrees, restricted to
0,45,90, or135(the orientations that tile seamlessly). Other values error.- spacing
Distance between repeats, in
units. Default4.- linewidth
Stripe / grid line width (as elsewhere in the package). Default
1.- units
Length unit for
spacing/size:"mm"(default),"in","pt","npc", or"native".- size
For
pattern_dot(), the dot diameter inunits; forpattern_checker(), the square size inunits.
Details
vplot(df) |> mark_bar(x = g, y = n, fill = pattern_stripe(angle = 45))A pattern is an unscaled value, not a data-mapped channel (like a gradient).
It applies to any filled mark: bars, areas, ribbons, rects, tiles, boxplots,
violins, ridgelines, half-eyes, hulls/ellipses, and sf polygons. To vary the
texture by a variable, map the pattern aesthetic instead (a discrete scale).
Patterns render on every backend (PNG, SVG, and — since the tile embeds as an image — PDF). The tile is rasterised at the scene resolution, so at extreme magnification it can soften; at ordinary sizes it is crisp.
Examples
df <- data.frame(g = c("a", "b", "c"), n = c(3, 5, 2))
vplot(df) |> mark_bar(x = g, y = n, fill = pattern_crosshatch())