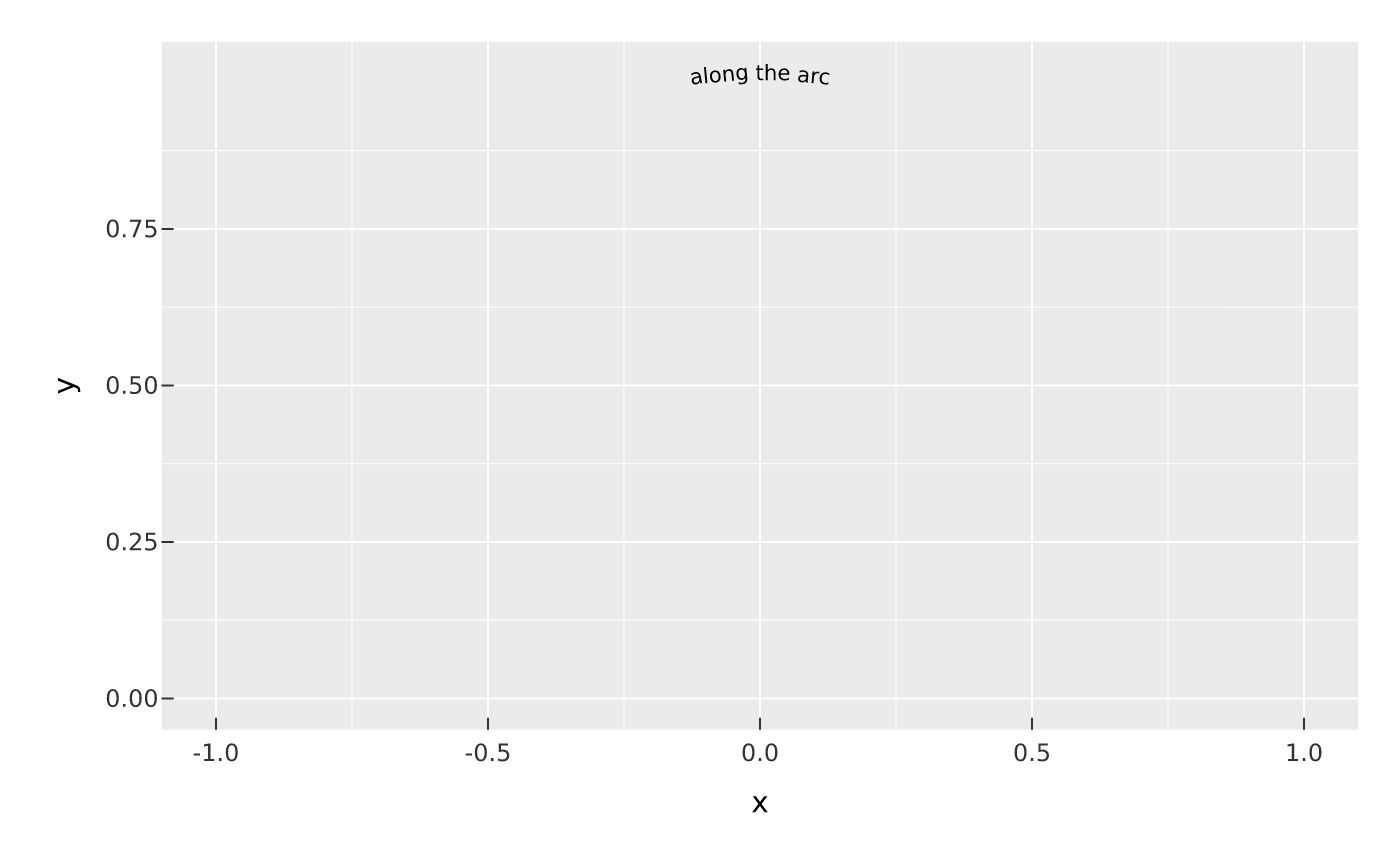
mark_text_path() draws a label that follows a curve — one string per
group, its glyphs placed along the group's x/y points (in data order) and
rotated to the local tangent. Use it for a label riding a contour, an arc, or
a trend line (a direct-labelling alternative to a legend), where
mark_text()'s point-anchored, axis-aligned labels do not fit.
Usage
mark_text_path(
  plot,
  ...,
  size = NULL,
  family = NULL,
  fontface = NULL,
  hjust = "centre",
  vjust = "centre",
  offset = 0,
  blend = NULL,
  data = NULL
)
Arguments
- plot
- ...
Encodings (tidy-eval):
x,y(the path),label(the string), and optionallycolor/groupto split into separate runs.- size
Font size in points.
- family, fontface
Font family and face (
"plain","bold", ...).- hjust
Where the run sits along the path:
"left"starts it at the first point,"centre"centres it,"right"ends it at the last point.- vjust
Vertical placement of the glyphs against the baseline.
- offset
Perpendicular standoff from the path, in points (positive is to the left of travel), for a label riding just above or below its curve.
- blend
Optional blend mode for compositing this layer against what is already drawn beneath it (the panel and earlier layers), one of the CSS
mix-blend-modenames, e.g."multiply","screen","darken". The whole layer composites as one isolated group (not per element).- data
Optional layer data frame; overrides the plot data for this layer.
Value
The modified PlotSpec.
Details
One label is drawn per group. Split groups the usual way — a discrete color
(or a distinct label) starts a new run — and the label is taken from the
group's first row (it is constant along the path). The points are used in the
order they appear in the data: pre-sort if the curve should be traversed in a
particular direction. Because glyphs follow the tangent (like SVG textPath),
a label on the underside of a closed curve reads upside-down; reverse the path
to flip it.
Examples
# Traverse the arc left-to-right so the glyphs read upright (a path walked
# right-to-left would set the label upside-down).
t <- seq(pi, 0, length.out = 40)
d <- data.frame(x = cos(t), y = sin(t), lab = "along the arc")
vplot(d) |> mark_text_path(x = x, y = y, label = lab)