Marks that summarise a set of (x, y) points (per group, when a color or
fill is mapped) as a single enclosing region drawn over the raw points.
Usage
mark_ellipse(
  plot,
  ...,
  type = "t",
  level = 0.95,
  segments = 51L,
  blend = NULL,
  sketch = NULL,
  data = NULL
)

mark_hull(plot, ..., expand = 0, blend = NULL, sketch = NULL, data = NULL)
Arguments
- plot
- ...
Encodings (tidy-eval):
x,y, and optionallycolor/fill(which also splits the points into per-group regions).- type
Ellipse type:
"t","norm", or"euclid".- level
Confidence level (
"t"/"norm") or circle radius ("euclid").- segments
Number of line segments approximating the ellipse.
- blend
Optional blend mode for compositing this layer against what is already drawn beneath it (the panel and earlier layers), one of the CSS
mix-blend-modenames, e.g."multiply","screen","darken". The whole layer composites as one isolated group (not per element).- sketch
A
sketch()spec giving this layer a hand-drawn look (wobbly outlines, hachure fills),NA/FALSEto force it crisp (overriding a plot-widetheme_sketch()), orNULL(default) to inherit. Geometry marks accept it; text, raster, hex and datashade marks do not.- data
Optional layer data frame; overrides the plot data for this layer.
- expand
For
mark_hull(), grow each hull outward from its centroid by this fraction (e.g.0.1= 10% larger), so it encloses the markers it wraps rather than passing through their centres.0(default) is the tight hull.
Value
The modified PlotSpec.
Details
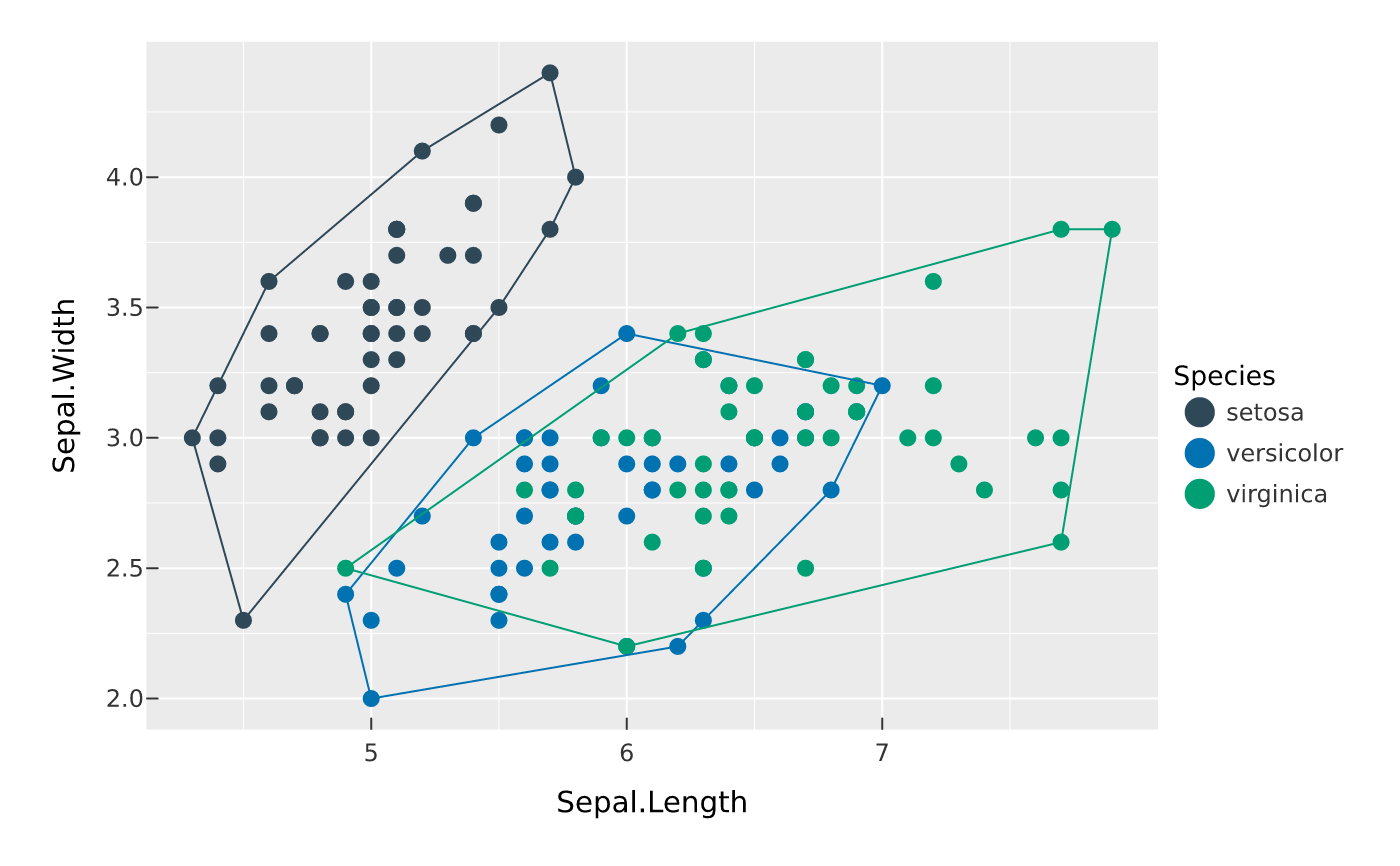
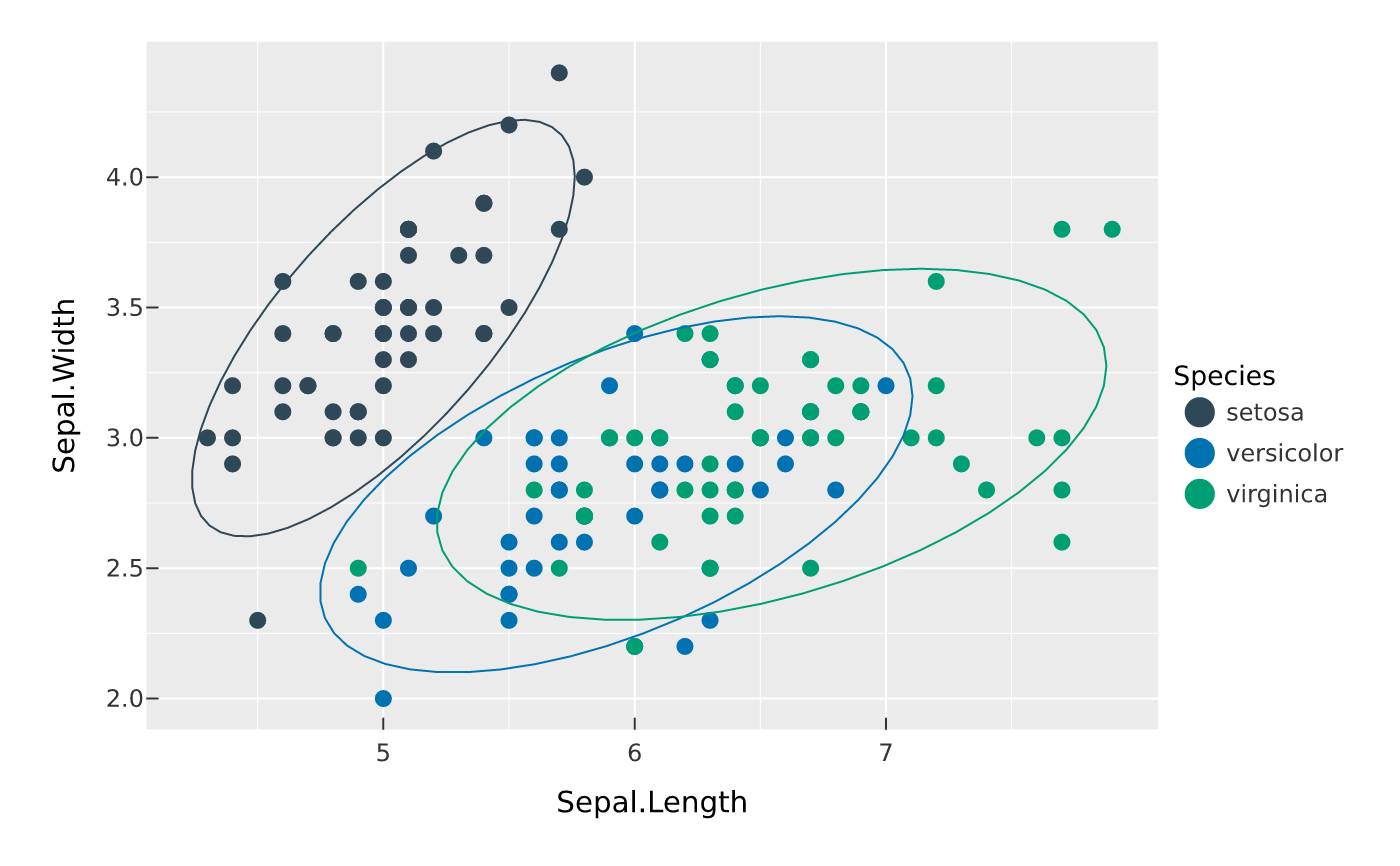
mark_ellipse()draws a covariance ellipse: atdistribution (type = "t", the default, robustly estimated via MASS), a multivariate normal ("norm"), or a Euclidean circle of radiuslevel("euclid"). The algorithm follows ggplot2'sstat_ellipse().mark_hull()draws the convex hull of the points.
Both are unfilled by default (a boundary), matching ggplot2; map or set a
fill to shade the region. A region needs at least 3 points per group;
smaller groups are skipped with a warning.
Examples
vplot(iris) |>
mark_point(x = Sepal.Length, y = Sepal.Width, color = Species) |>
mark_ellipse(x = Sepal.Length, y = Sepal.Width, color = Species)
 vplot(iris) |>
mark_point(x = Sepal.Length, y = Sepal.Width, color = Species) |>
mark_hull(x = Sepal.Length, y = Sepal.Width, color = Species)
vplot(iris) |>
mark_point(x = Sepal.Length, y = Sepal.Width, color = Species) |>
mark_hull(x = Sepal.Length, y = Sepal.Width, color = Species)