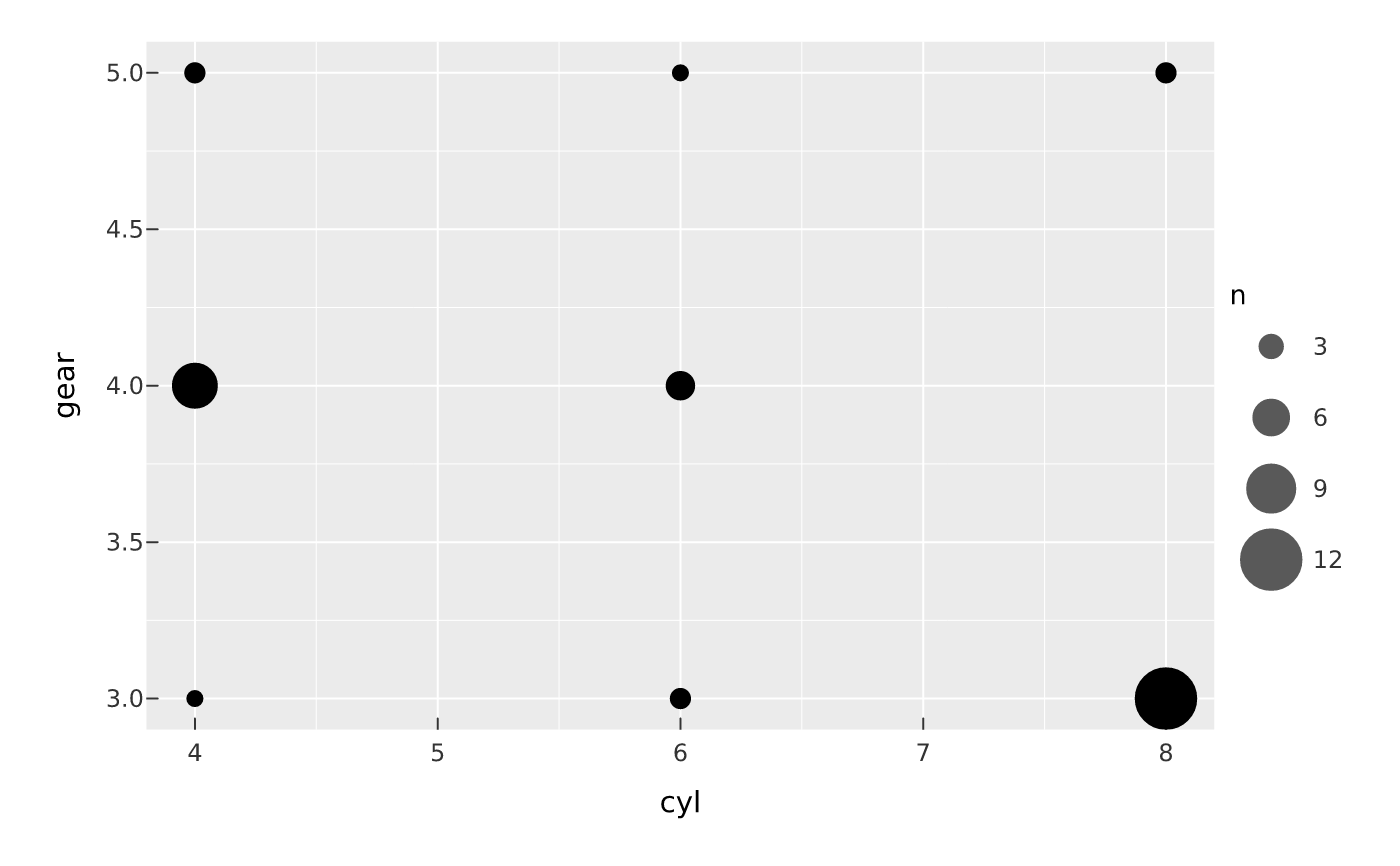
mark_count() collapses coincident (x, y) observations to one point sized
by how many fall there (ggplot2's geom_count() / stat_sum()) — the honest
way to show overplotting on a discrete or rounded grid. size defaults to
after_stat(n) (the overlap count); map it to after_stat(prop) for the
proportion instead.
Arguments
- plot
- ...
Encodings (tidy-eval):
x,y(+color/fillto count within groups, andsizeto override the defaultafter_stat(n)).- blend
Optional blend mode for compositing this layer against what is already drawn beneath it (the panel and earlier layers), one of the CSS
mix-blend-modenames, e.g."multiply","screen","darken". The whole layer composites as one isolated group (not per element).- sketch
A
sketch()spec giving this layer a hand-drawn look (wobbly outlines, hachure fills),NA/FALSEto force it crisp (overriding a plot-widetheme_sketch()), orNULL(default) to inherit. Geometry marks accept it; text, raster, hex and datashade marks do not.- data
Optional layer data frame; overrides the plot data for this layer.
Value
The modified PlotSpec.
Examples
vplot(mpg <- data.frame(cyl = mtcars$cyl, gear = mtcars$gear)) |>
  mark_count(x = cyl, y = gear)