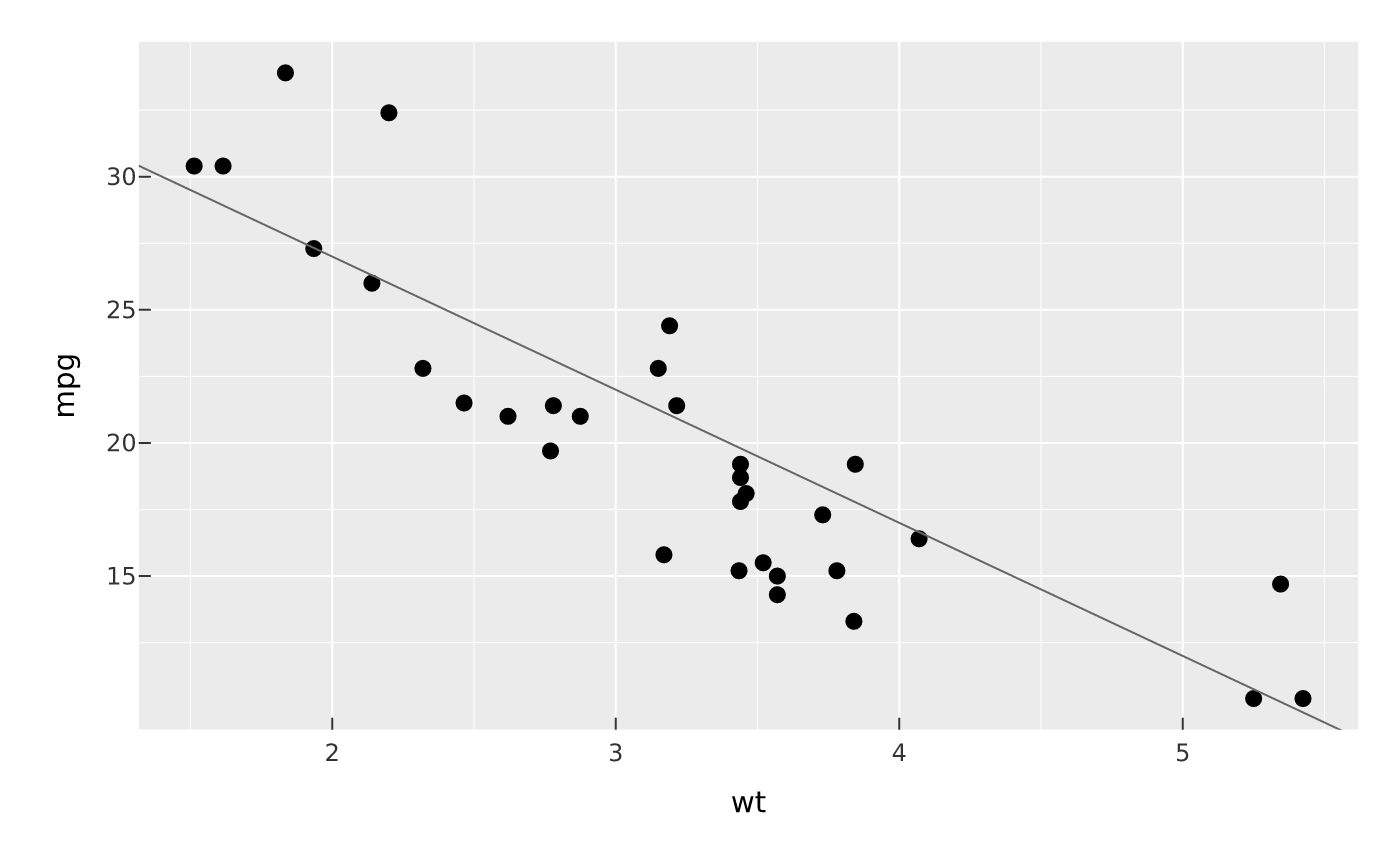
mark_abline() draws a sloped reference line y = slope * x + intercept
across the panel (the diagonal cousin of mark_rule()'s horizontal/vertical
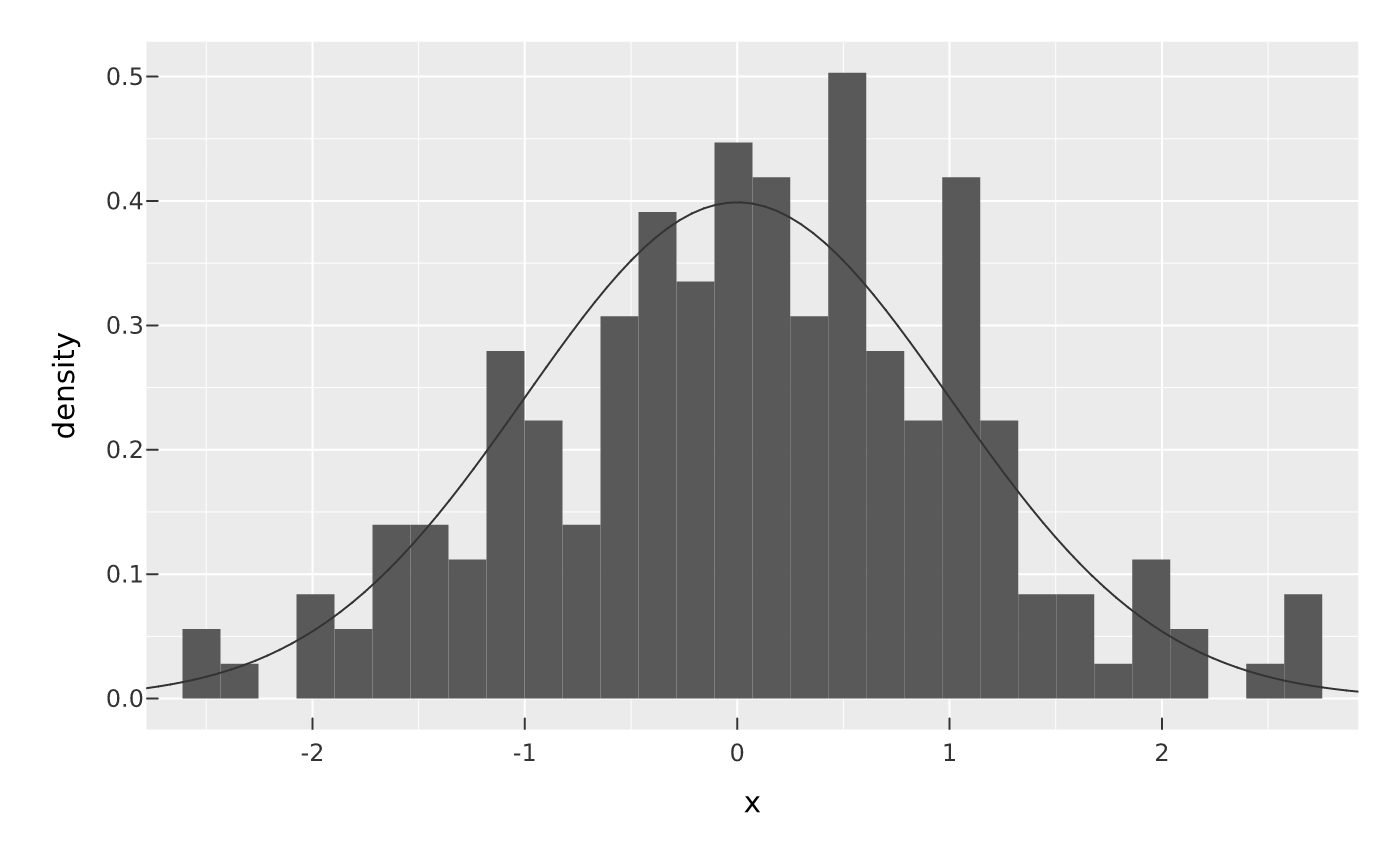
lines). mark_function() draws a curve y = fun(x) sampled over the panel's
x range — e.g. a theoretical density over a histogram, or a reference curve
over a scatter. Both take no data encodings; they reuse the panel's existing
x/y scales, so add them on top of a data layer. Both assume linear axes.
Usage
mark_abline(
  plot,
  ...,
  slope = 1,
  intercept = 0,
  blend = NULL,
  sketch = NULL,
  data = NULL
)

mark_function(
  plot,
  ...,
  fun,
  n = 101,
  args = list(),
  blend = NULL,
  sketch = NULL,
  data = NULL
)
Arguments
- plot
A PlotSpec.
- ...
For
mark_abline()/mark_function(), styling passed through as constants (e.g.color,linewidth,linetype).- slope, intercept
For
mark_abline(), the line's slope and intercept (each may be a vector to draw several lines). Defaults1and0.- blend, sketch, data
See
mark_point().- fun
For
mark_function(), a function (or its name) mapping a numericxvector toy, e.g.dnormor\(x) x^2.- n
For
mark_function(), the number of points sampled across the x range. Default101.- args
For
mark_function(), extra arguments passed tofun(e.g.args = list(mean = 5, sd = 2)).
Value
The modified PlotSpec.
Examples
vplot(mtcars) |> mark_point(x = wt, y = mpg) |> mark_abline(slope = -5, intercept = 37)
 vplot(data.frame(x = rnorm(200))) |>
mark_histogram(x = x, y = after_stat(density)) |>
mark_function(fun = dnorm)
vplot(data.frame(x = rnorm(200))) |>
mark_histogram(x = x, y = after_stat(density)) |>
mark_function(fun = dnorm)