Convenience wrappers that declare a scale carrying only its limits, instead of
spelling out a full scale_*(). xlim() / ylim() set the position range;
lims() sets limits for any named aesthetic. They are shortcuts for
scale_*(limits = ...): like there, an explicit range sets the trained
(view) window and marks outside it are clipped.
Arguments
- plot
A PlotSpec.
- ...
For
xlim()/ylim(), the limits: two numbersxlim(0, 10)(or a length-2 vector) for a continuous axis, or a set of levelsxlim("a", "b", "c")for a discrete one. Forlims(), named limit vectors, one per aesthetic, e.g.lims(x = c(0, 10), color = c(0, 100)).
Value
The modified PlotSpec.
Examples
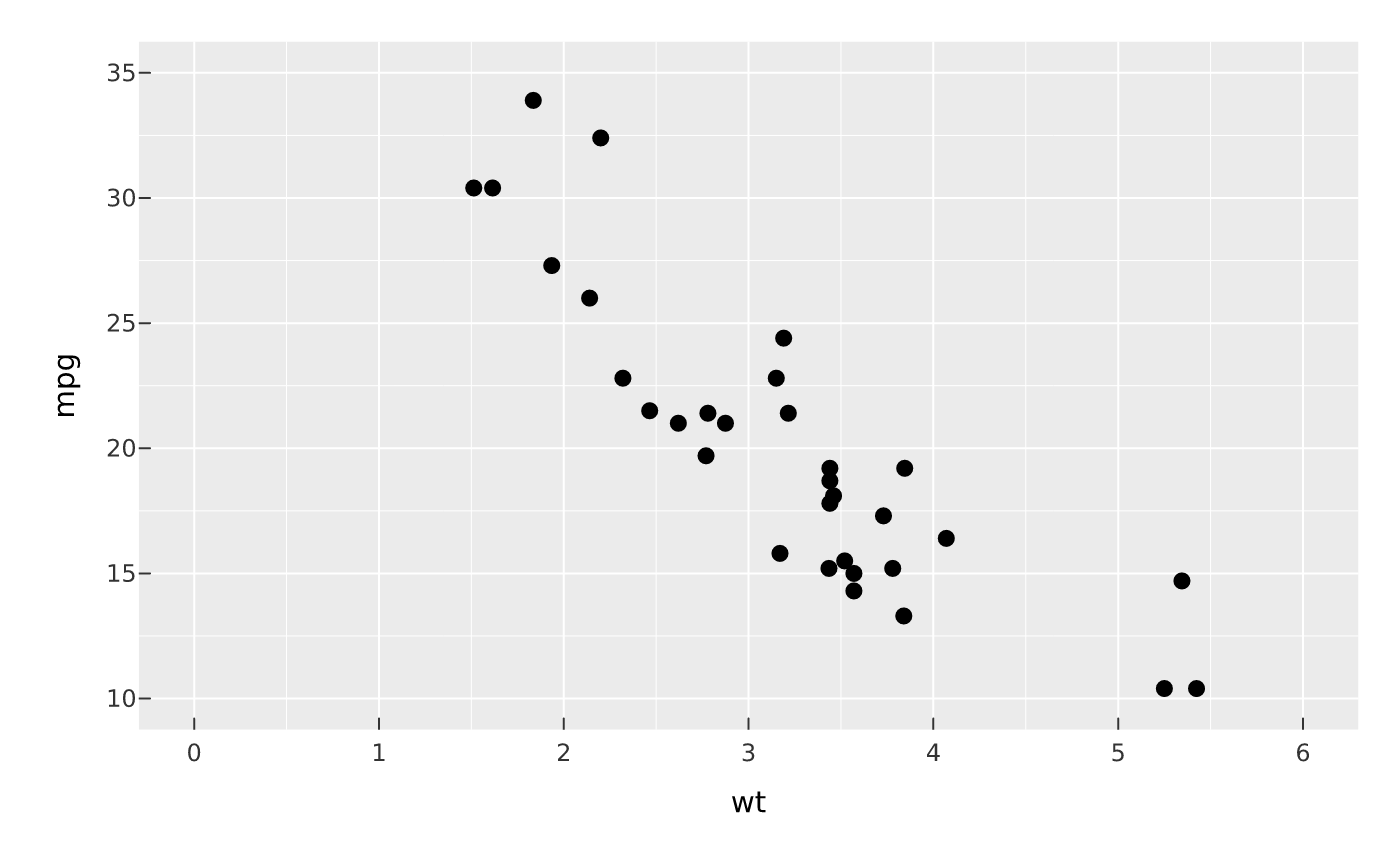
vplot(mtcars) |> mark_point(x = wt, y = mpg) |> xlim(0, 6)
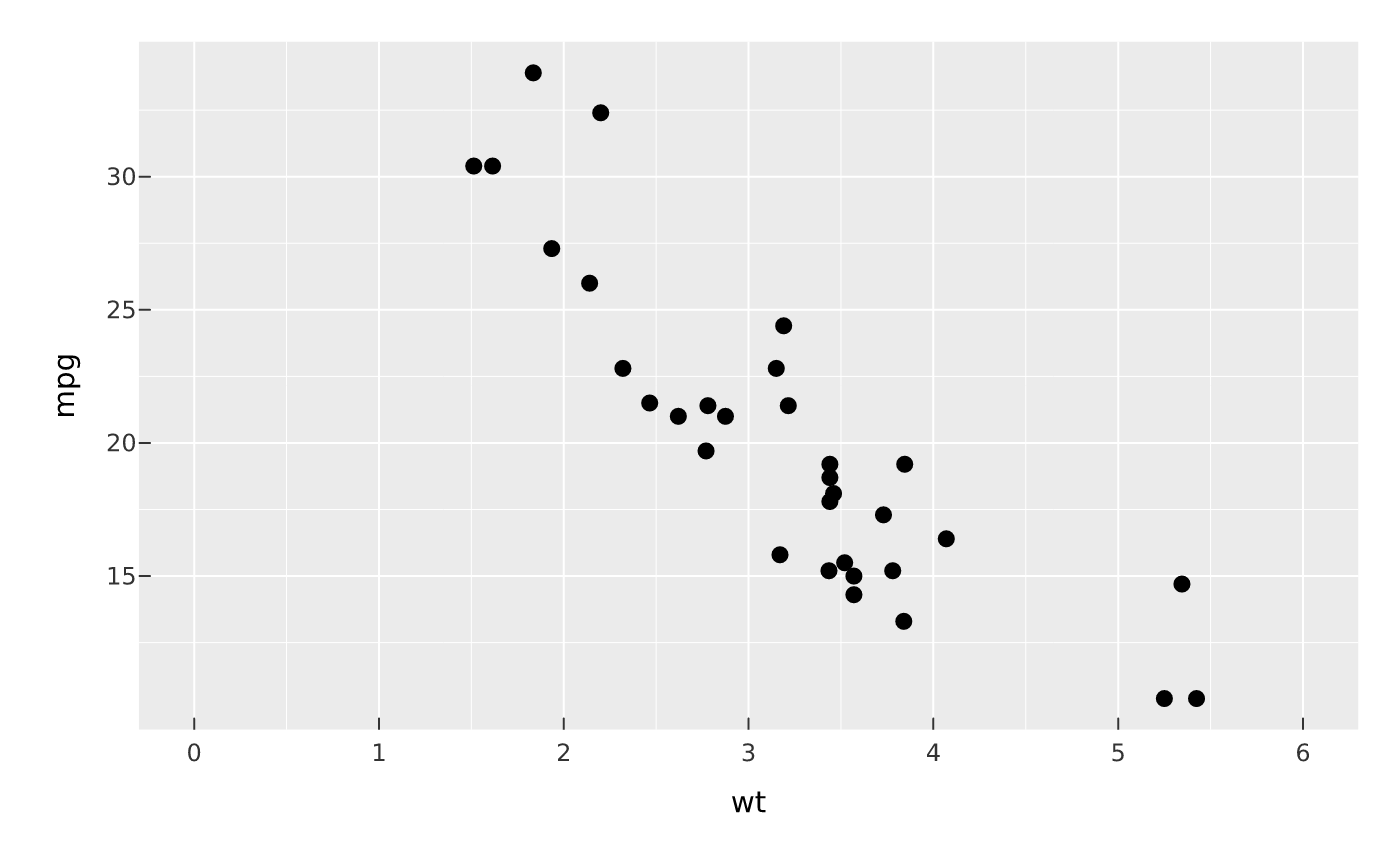 vplot(mtcars) |> mark_point(x = wt, y = mpg) |> lims(x = c(0, 6), y = c(10, 35))