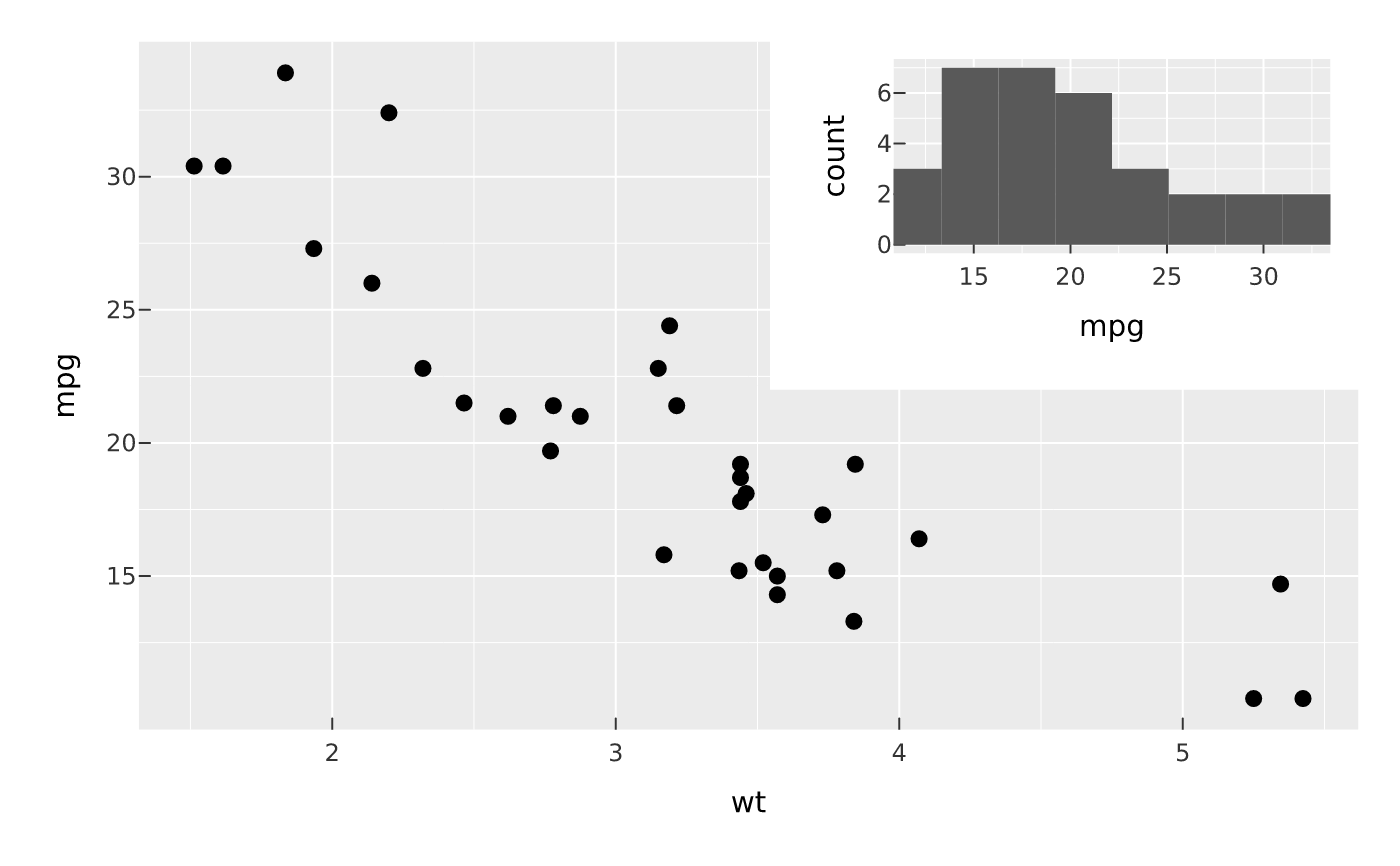
Place plot as an inset over base, positioned by fractional coordinates
(0–1) of the chosen reference box. Returns a 1-cell PlotComposition carrying
the inset (compose it further or render directly).
Usage
inset(
  base,
  plot,
  left = 0.6,
  bottom = 0.6,
  right = 0.98,
  top = 0.98,
  align_to = c("panel", "plot", "full"),
  on_top = TRUE
)Examples
a <- vplot(mtcars) |> mark_point(x = wt, y = mpg)
b <- vplot(mtcars) |> mark_histogram(x = mpg, bins = 8)
inset(a, b, left = 0.55, bottom = 0.55, right = 0.98, top = 0.98)