
Draw a single mark (or a short vector of them) from values supplied directly,
rather than mapping a data column. The values become a small inline layer
data frame, so annotations are independent of the plot data (and repeat on
every facet panel). Supported geoms: "text", "label", "point",
"segment", "rect", "grob", and "sparkline".
Usage
annotate(
  plot,
  geom,
  x = NULL,
  y = NULL,
  xend = NULL,
  yend = NULL,
  xmin = NULL,
  xmax = NULL,
  ymin = NULL,
  ymax = NULL,
  label = NULL,
  ...
)
Arguments
- plot
A PlotSpec.
- geom
The annotation geometry: one of
"text","label","point","segment","rect","grob","sparkline".- x, y
Position (text/label/point/grob/sparkline; segment start).
- xend, yend
Segment end.
- xmin, xmax, ymin, ymax
Rectangle extent.
- label
Text to draw (text/label).
- ...
Constant aesthetics passed to the mark (e.g.
color,fill,alpha,size). For"grob":grob =(a vellum grob orPlotSpec). For"sparkline":values =plus anyvsparkline()argument. Both acceptwidth/height/units(the box, default20 x 6mm) andhalign("left"/"centre"/"right") /valign("top"/"centre"/"bottom") to anchor the box relative to(x, y).
Value
The modified PlotSpec.
Details
"grob" places an arbitrary vellum grob (or a PlotSpec, e.g. a
vsparkline()) at data coordinate(s), in a box of physical size — a general
"glyph / chart in a panel" seam. "sparkline" is the convenience for the
common case: pass values = and it builds and places a vsparkline().
Examples
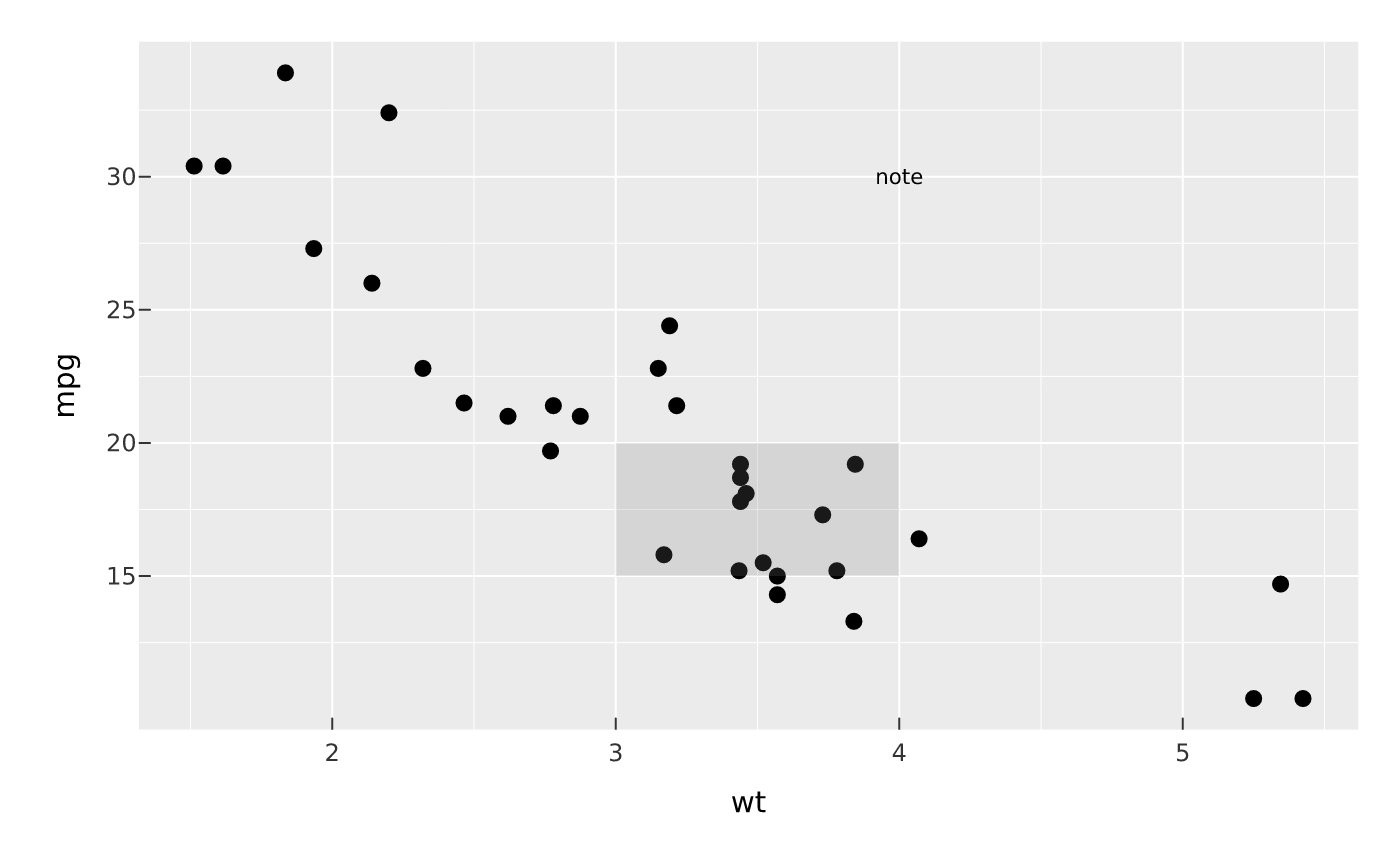
vplot(mtcars) |>
mark_point(x = wt, y = mpg) |>
annotate("text", x = 4, y = 30, label = "note") |>
annotate("rect", xmin = 3, xmax = 4, ymin = 15, ymax = 20, alpha = 0.2)
 if (FALSE) { # \dontrun{
vplot(mtcars) |>
mark_point(x = wt, y = mpg) |>
annotate("sparkline", x = 4, y = 30, values = cumsum(rnorm(30)))
} # }
if (FALSE) { # \dontrun{
vplot(mtcars) |>
mark_point(x = wt, y = mpg) |>
annotate("sparkline", x = 4, y = 30, values = cumsum(rnorm(30)))
} # }