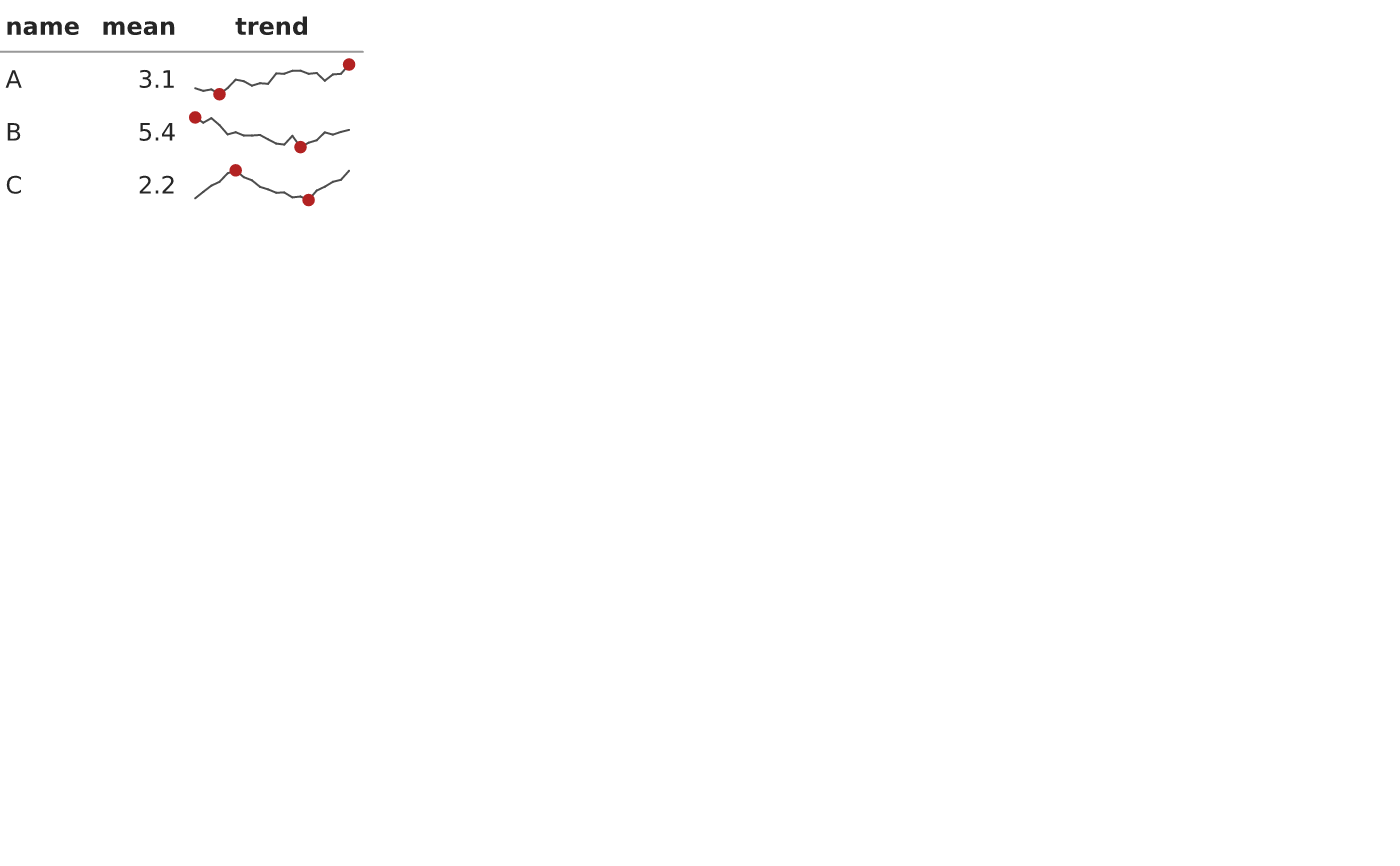
vtable() lays a data frame out as a grid of cells where an ordinary column
renders as text and a list-column of numeric vectors renders as a
per-row vsparkline() — chart-in-table, drawn as one vector scene (so it
renders on PNG / SVG / PDF like any plot). It returns a compiled object;
render_plot() it, print() it, or drop it into a composition.
Usage
vtable(
  data,
  spark = list(),
  cols = NULL,
  align = NULL,
  header = TRUE,
  font_size = 9,
  spark_width = 24,
  row_height = 7,
  cell_pad = 1.5,
  units = "mm",
  dpi = 96
)
Arguments
- data
A data frame. Sparkline columns must be list-columns whose cells are numeric vectors.
- spark
A named list mapping a (list-)column name to how it draws: a
typestring ("line"/"bar"/"winloss") or a functionfunction(values)returning avsparkline().- cols
Character vector of columns to show, in order (default all).
- align
Optional named list of per-column alignment (
"left"/"right"/"centre"); defaults to right for numeric, left otherwise.- header
Draw a bold header row with an underline (default
TRUE).- font_size
Text size in points (default
9).- spark_width
Width of a sparkline column, in
units(default24).- row_height
Row height, in
units(default7).- cell_pad
Horizontal padding inside a text cell, in
units(default1.5).- units
Length unit for the sizes above:
"mm"(default),"cm","in","pt".- dpi
Resolution for raster output.
Value
A VTable (renders via render_plot()).