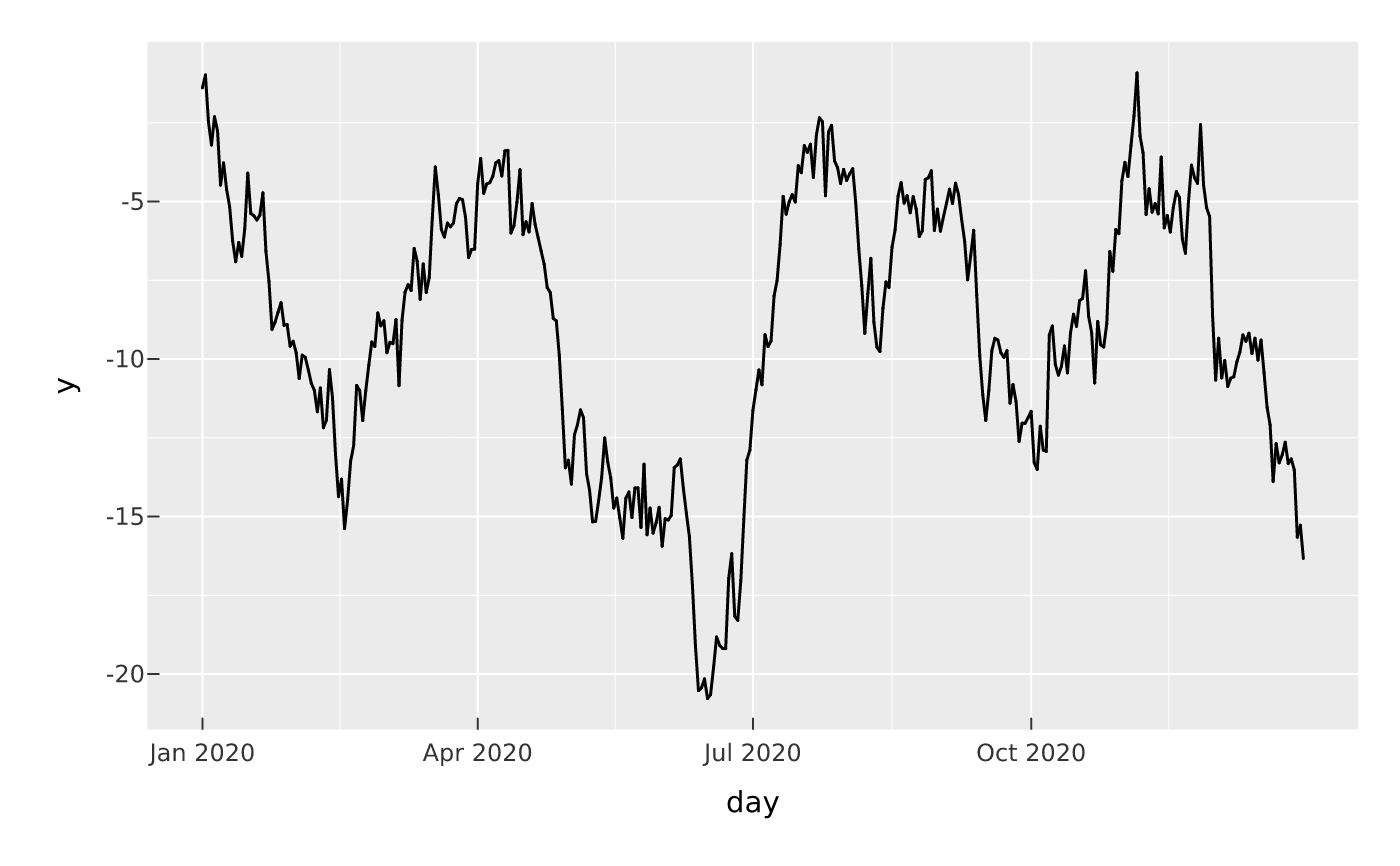
Position scales for Date (scale_*_date), date-time POSIXct
(scale_*_datetime), and time-of-day / difftime / hms
(scale_*_time) axes. A Date/POSIXct column already gets a sensible date
axis automatically; declare one of these to control the break interval or the
label format.
Usage
scale_x_date(
  plot,
  limits = NULL,
  date_breaks = NULL,
  date_labels = NULL,
  breaks = NULL,
  labels = NULL,
  name = NULL
)

scale_y_date(
  plot,
  limits = NULL,
  date_breaks = NULL,
  date_labels = NULL,
  breaks = NULL,
  labels = NULL,
  name = NULL
)

scale_x_datetime(
  plot,
  limits = NULL,
  date_breaks = NULL,
  date_labels = NULL,
  breaks = NULL,
  labels = NULL,
  name = NULL
)

scale_y_datetime(
  plot,
  limits = NULL,
  date_breaks = NULL,
  date_labels = NULL,
  breaks = NULL,
  labels = NULL,
  name = NULL
)

scale_x_time(
  plot,
  limits = NULL,
  date_breaks = NULL,
  date_labels = NULL,
  breaks = NULL,
  labels = NULL,
  name = NULL
)

scale_y_time(
  plot,
  limits = NULL,
  date_breaks = NULL,
  date_labels = NULL,
  breaks = NULL,
  labels = NULL,
  name = NULL
)
Arguments
- plot
A PlotSpec.
- limits
Length-2 vector giving the axis range (same class as the data), or
NULLto train from the data.- date_breaks
A break interval string, e.g.
"1 month","2 weeks","10 years"(passed toscales::breaks_width()).NULLusespretty().- date_labels
A
base::strftime()format string for the tick labels, e.g."%b %Y".NULLuses the default format.- breaks, labels
Explicit break positions / labels (override
date_breaks/date_labels), orNULL.- name
Axis title, or
NULLto derive from the encoding.
Value
The modified PlotSpec.