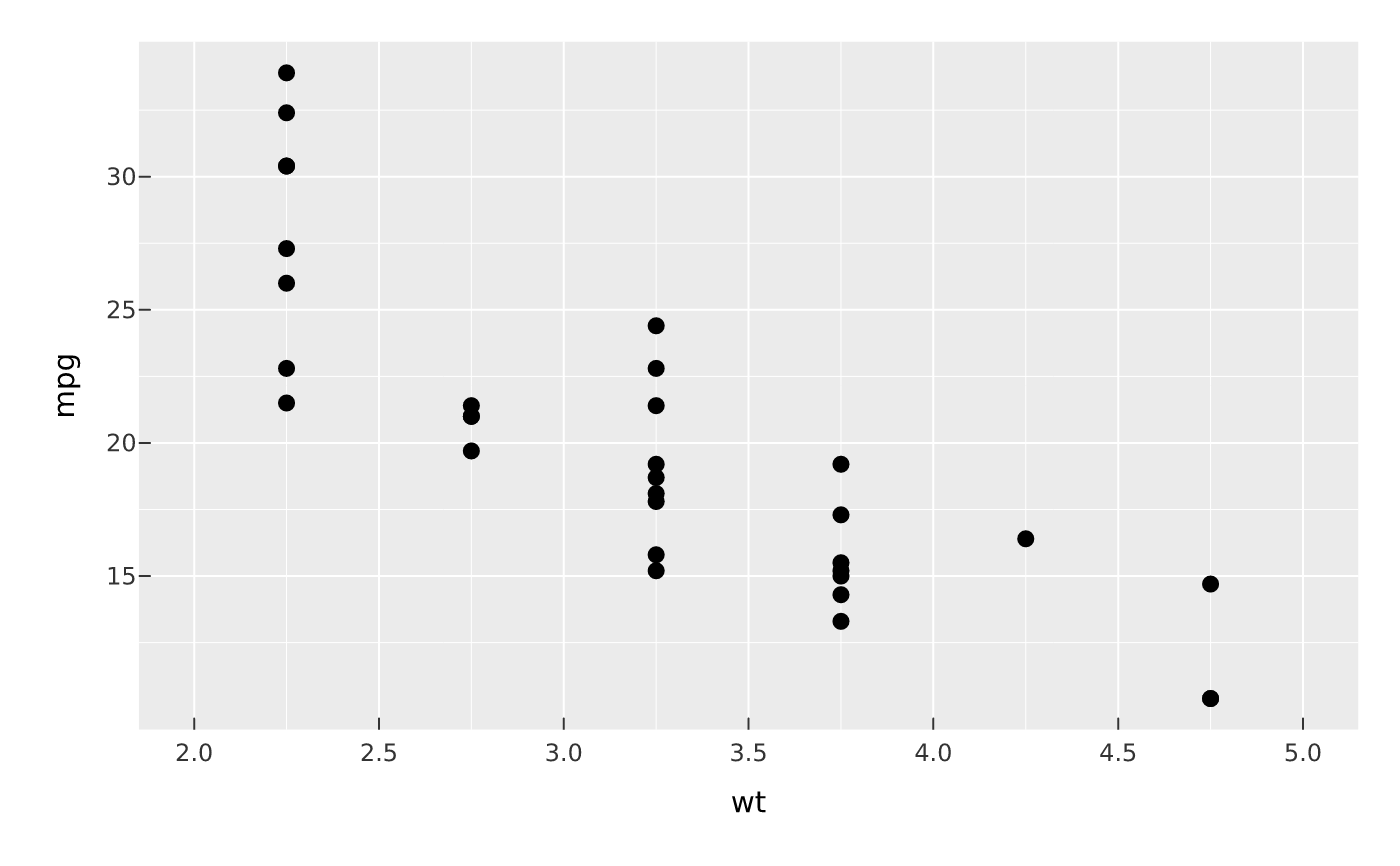
scale_x_binned() / scale_y_binned() cut a continuous position variable into
bins: axis ticks fall at the bin boundaries and each datum is drawn at its
bin centre. Breaks use the same classification as the binned colour scales
(style/n; classInt for jenks/fisher/… — a Suggest). Handy to summarise a
dense continuous axis, or to place mark_bar() on a binned continuous x.
Usage
scale_x_binned(
  plot,
  style = "pretty",
  n = 10,
  breaks = NULL,
  labels = NULL,
  name = NULL
)

scale_y_binned(
  plot,
  style = "pretty",
  n = 10,
  breaks = NULL,
  labels = NULL,
  name = NULL
)
Arguments
- plot
A PlotSpec.
- style
Binning style:
"pretty"(default),"equal","quantile", or aclassIntstyle.- n
Target number of bins.
- breaks
Explicit bin boundaries (overrides
style/n), orNULL.- labels
Explicit boundary labels, or
NULLto format the boundaries.- name
Axis title, or
NULLto derive from the encoding.
Value
The modified PlotSpec.
Examples
vplot(mtcars) |> mark_point(x = wt, y = mpg) |> scale_x_binned(n = 6)