Use the data values directly as the aesthetic — no training and no legend.
The mapped column must already contain valid aesthetic values: colours for
scale_color_identity() / scale_fill_identity(), sizes in mm for
scale_size_identity(), and shape names for scale_shape_identity(). Useful
when a column already holds the exact colours/sizes you want to draw.
Usage
scale_color_identity(plot)

scale_fill_identity(plot)

scale_colour_identity(plot)

scale_size_identity(plot)

scale_shape_identity(plot)

scale_alpha_identity(plot)

scale_linetype_identity(plot)
Arguments
- plot
A PlotSpec.
Value
The modified PlotSpec.
Examples
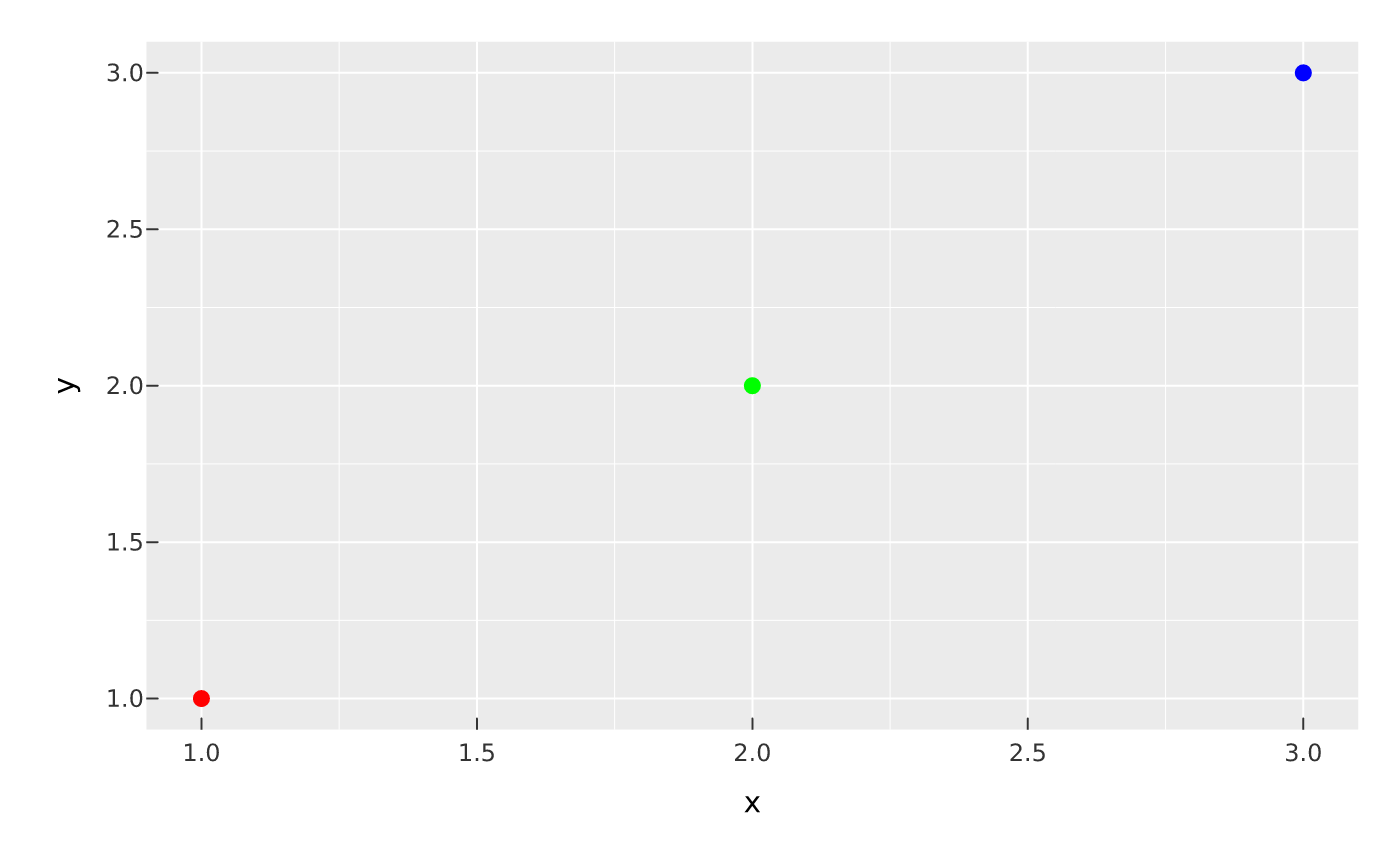
df <- data.frame(x = 1:3, y = 1:3, col = c("red", "green", "blue"))
vplot(df) |> mark_point(x = x, y = y, color = col) |> scale_color_identity()