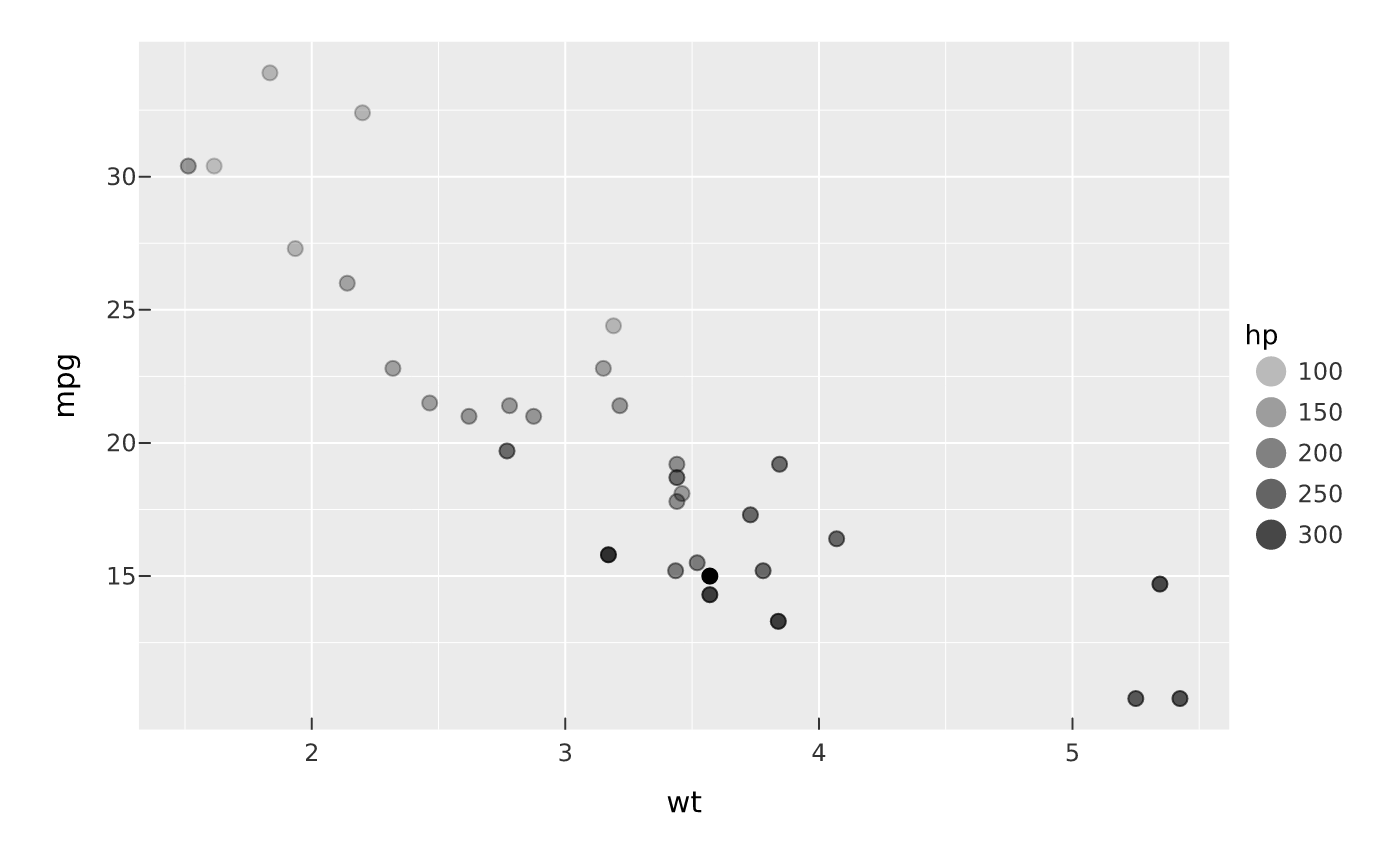
Declare the scale for a mapped alpha aesthetic: data values map to an
opacity range in [0, 1]. An alpha legend is drawn automatically.
Usage
scale_alpha(plot, range = NULL, limits = NULL, breaks = NULL, name = NULL)

scale_alpha_continuous(
  plot,
  range = NULL,
  limits = NULL,
  breaks = NULL,
  name = NULL
)
Arguments
- plot
A PlotSpec.
- range
Numeric length-2 output opacity range, or
NULLfor the defaultc(0.1, 1).- limits
Numeric length-2 data domain, or
NULLto train from the data.- breaks
Explicit legend breaks, or
NULL.- name
Legend title, or
NULLto derive from the encoding.
Value
The modified PlotSpec.
Examples
vplot(mtcars) |> mark_point(x = wt, y = mpg, alpha = hp) |> scale_alpha(range = c(0.2, 1))