Fine-grained control over how a mark's overlapping elements are placed. Pass
the result to a mark's position argument (e.g.
mark_point(position = position_jitter(width = 0.2))). A bare string
(position = "dodge") still works and uses the defaults.
Usage
position_nudge(x = 0, y = 0)

position_jitter(width = NULL, height = NULL, seed = NULL)

position_dodge(width = NULL)

position_dodge2(padding = 0.1)

position_sina(width = 0.8, seed = NULL)

position_jitterdodge(
  jitter.width = NULL,
  jitter.height = 0,
  dodge.width = 0.75,
  seed = NULL
)
Arguments
- x, y
position_nudge()shift (data units).- width, height
Maximum jitter (data units);
NULLuses the default. Forposition_sina(),widthis the spread as a fraction of the band.- seed
Optional integer seed for the random jitter.
- padding
position_dodge2()gap between dodged elements, as a fraction of the element width.- dodge.width, jitter.width, jitter.height
position_jitterdodge()dodge / jitter extents.
Details
position_nudge()shifts every element by a constant amount in data units (for continuous axes) — handy for offsetting labels from points.position_jitter()adds uniform random noise;width/heightare the maximum shift in data units (default: 40% of the resolution),seedmakes it reproducible.position_dodge()places grouped elements side by side;widthis the total data-space width shared by the group (default: the category band).position_dodge2()dodges by the groups actually present at each x and splits the band between them with apaddinggap — so ragged groupings stay centred and evenly spaced.position_jitterdodge()dodges grouped elements, then jitters within each dodged slot (points over dodged boxes).position_sina()spreads each category's points along x by a quasirandom offset scaled to the local y-density, so the cloud traces the distribution's shape (ggforce's sina).widthis the maximum spread as a fraction of the category band (default0.8).
Examples
vplot(mtcars) |>
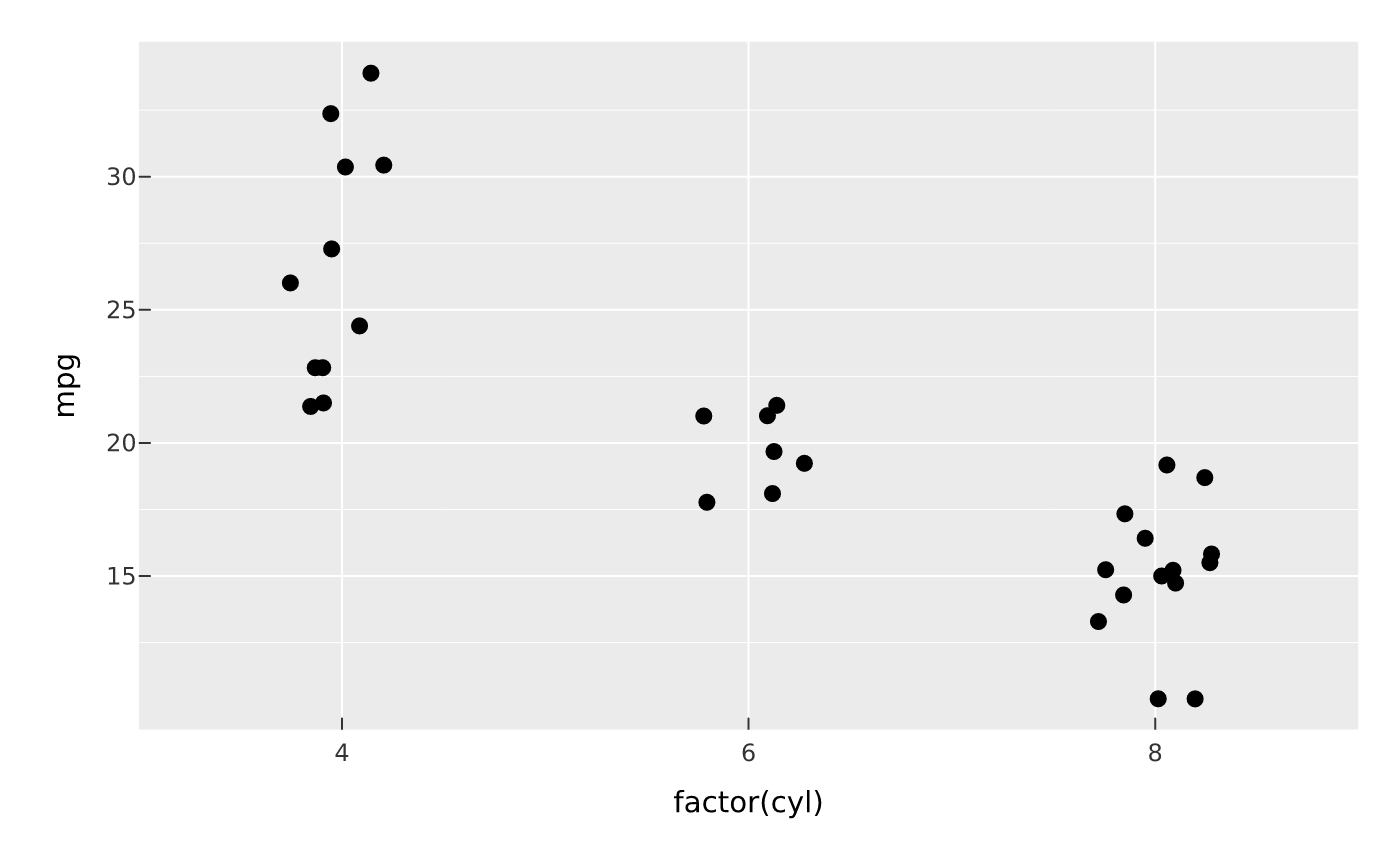
  mark_point(x = factor(cyl), y = mpg, position = position_jitter(width = 0.15))