Marks that summarise the distribution of a variable.
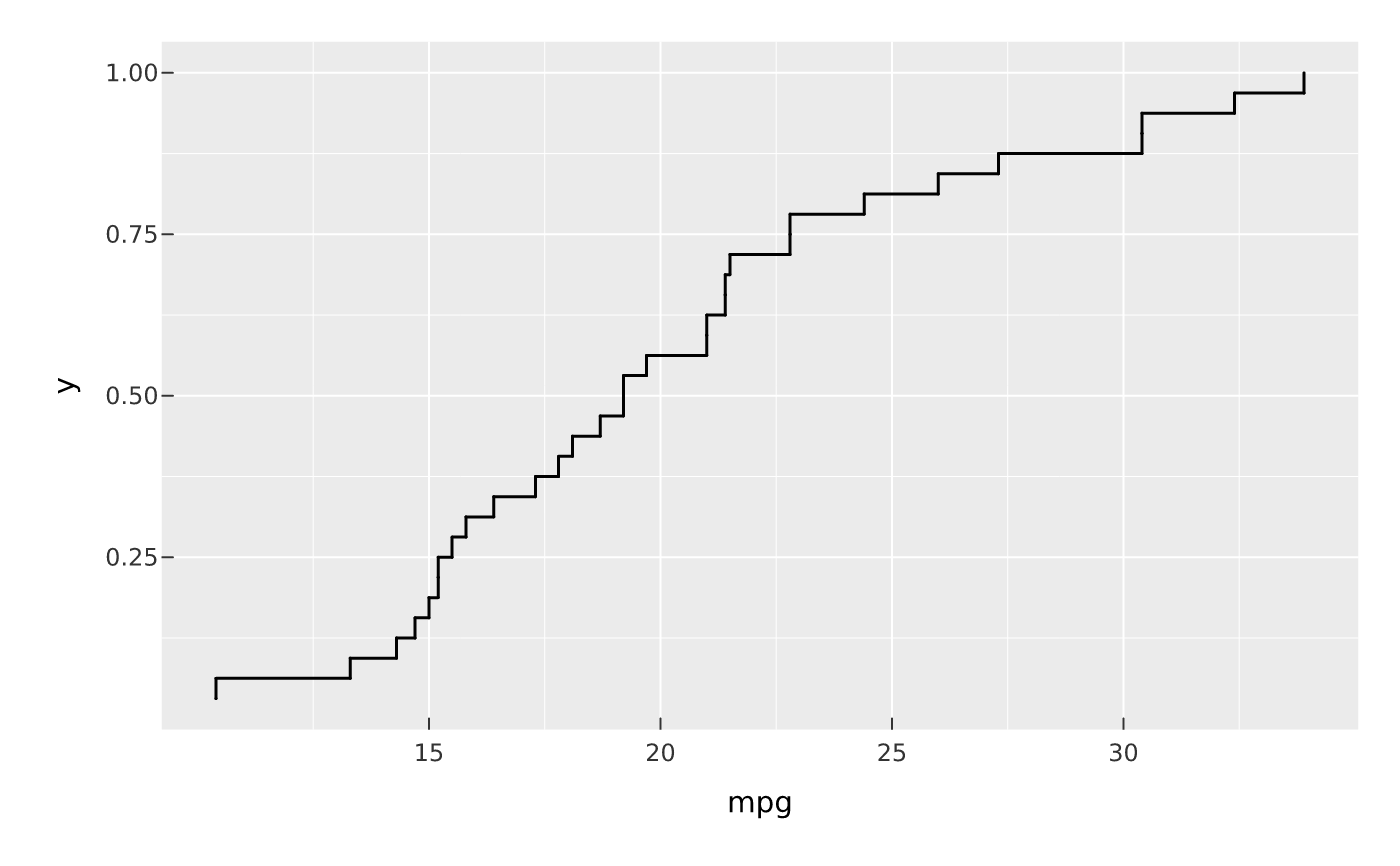
mark_ecdf() draws the empirical cumulative distribution of x as a step;
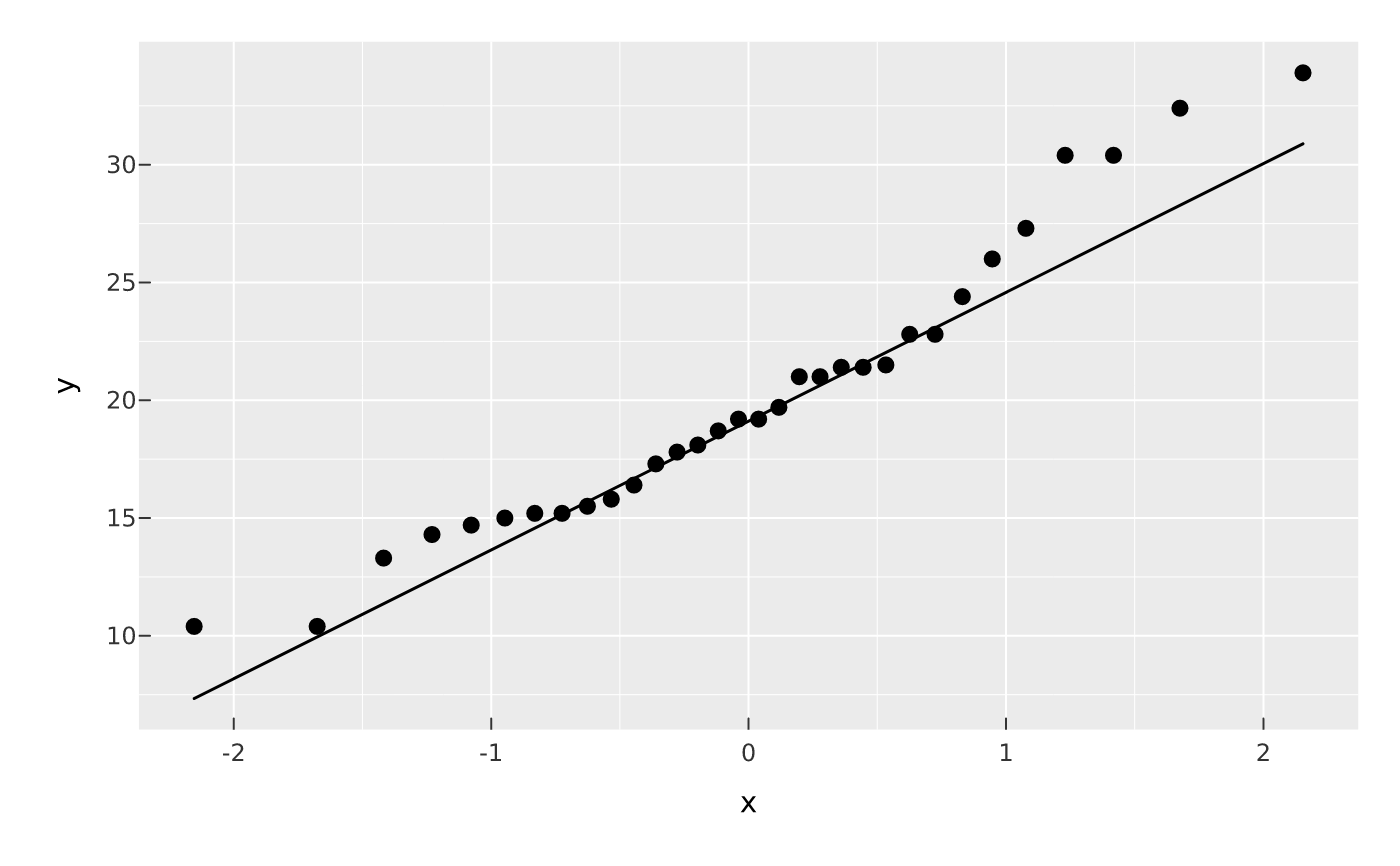
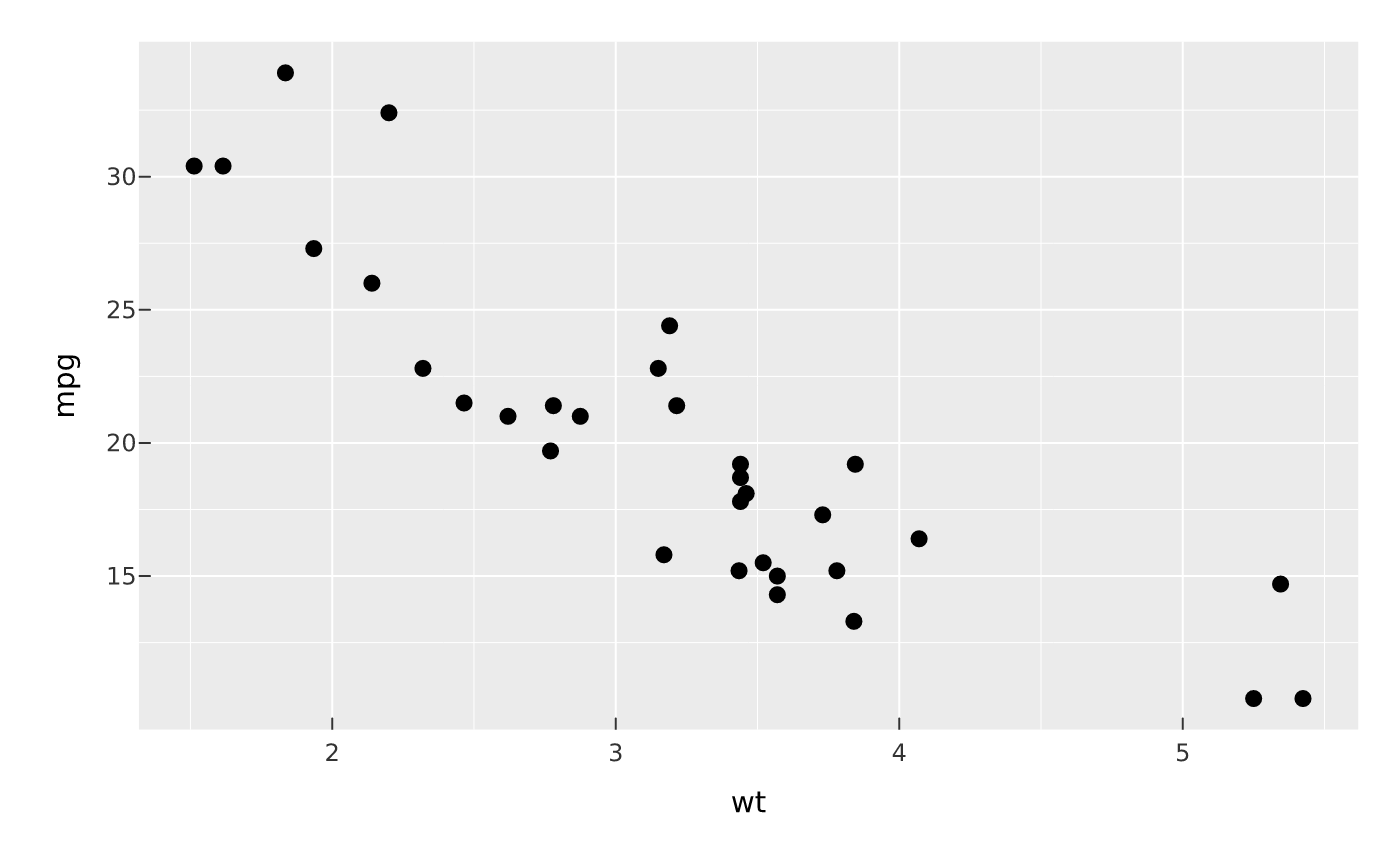
mark_rug() draws marginal ticks at each datum; mark_qq() draws a
quantile-quantile plot of a sample against a theoretical distribution, with
mark_qq_line() adding the reference line. All respect a mapped color/fill
grouping.
Usage
mark_ecdf(plot, ..., blend = NULL, sketch = NULL, data = NULL)

mark_rug(plot, ..., sides = "bl", length = 0.03, blend = NULL, data = NULL)

mark_qq(
  plot,
  ...,
  distribution = "qnorm",
  blend = NULL,
  sketch = NULL,
  data = NULL
)

mark_qq_line(
  plot,
  ...,
  distribution = "qnorm",
  blend = NULL,
  sketch = NULL,
  data = NULL
)
Arguments
- plot
A PlotSpec.
- ...
Encodings.
mark_ecdf()needsx;mark_qq()/mark_qq_line()needsample;mark_rug()takesxand/ory(+color,alpha,linewidth,linetype).- blend, sketch, data
Standard layer arguments (see
mark_point()).- sides
Which edges
mark_rug()draws ticks on: any of"b"(bottom),"l"(left),"t"(top),"r"(right); default"bl".- length
Rug tick length as a fraction of the panel (default
0.03).- distribution
Quantile function of the reference distribution for
mark_qq()/mark_qq_line()(default stats::qnorm).
Value
The modified PlotSpec.
Examples
vplot(mtcars) |> mark_ecdf(x = mpg)
 vplot(mtcars) |> mark_point(x = wt, y = mpg) |> mark_rug()
 vplot(mtcars) |> mark_qq(sample = mpg) |> mark_qq_line(sample = mpg)