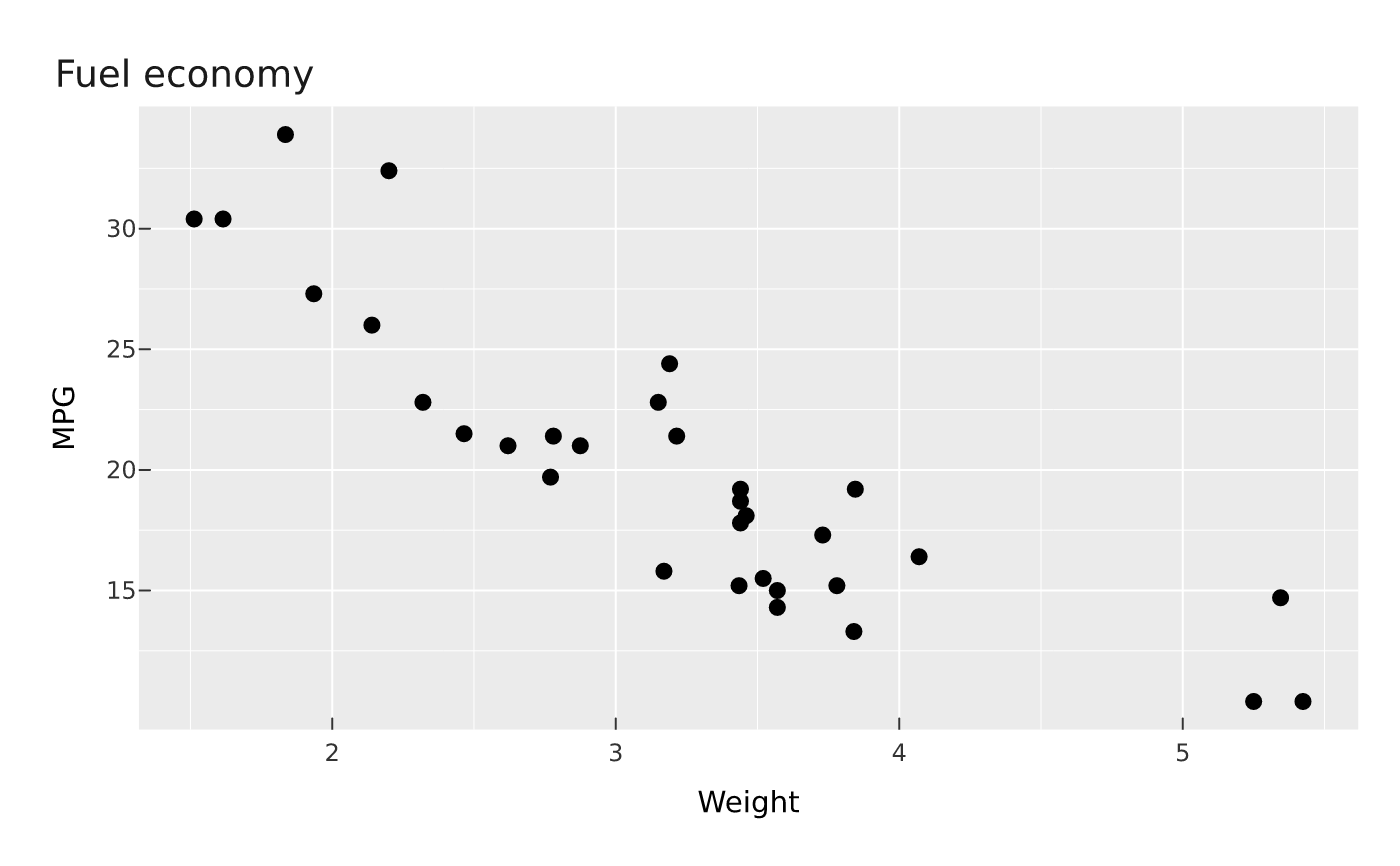
Add plot-level text — a title, subtitle, caption, and tag — and
override the titles of individual axes and legends (x, y, color, size).
The title, subtitle, and tag are drawn in a band above the panels; the caption
in a band below. Repeated labs() calls merge, with later values winning.
Usage
labs(
  plot,
  title = NULL,
  subtitle = NULL,
  caption = NULL,
  tag = NULL,
  x = NULL,
  y = NULL,
  color = NULL,
  colour = NULL,
  fill = NULL,
  size = NULL,
  alt = NULL,
  ...
)
Arguments
- plot
A PlotSpec.
- title, subtitle, caption, tag
Plot-level text (or
NULLto leave unset).- x, y, size
Axis / legend title overrides for those aesthetics.
- color, colour, fill
Colour-scale title override;
colourandfillare aliases forcolor.- alt
A text alternative (alt text) describing the plot for screen readers and other assistive technology. Overrides the description vellumplot generates automatically; see
plot_alt(). Emitted into the accessible SVG (<desc>) and tagged PDF (FigureAlt) byrender_plot().- ...
Reserved; passing anything here is an error.
Value
The modified PlotSpec.
Details
Axis/legend overrides set here are used unless a matching scale_*(name = )
is also given, which takes precedence. With neither, the title is derived from
the mapping.
Examples
vplot(mtcars) |>
  mark_point(x = wt, y = mpg) |>
  labs(title = "Fuel economy", x = "Weight", y = "MPG")