guides() overrides the legend (guide) for one or more aesthetics without
respelling the whole scale_*(). Pass "none" (or guide_none()) to hide a
legend, guide_legend() to tweak a keyed legend (reverse the key order,
override the title, restyle the keys with override.aes), guide_colourbar()
to size, tick and style a continuous colour bar, or guide_coloursteps() to draw a
binned colour scale as a segmented bar instead of swatches. Applies to the
non-position legends (color/fill, size, shape, alpha, linetype);
position axes are unaffected.
Usage
guides(plot, ...)

guide_none()

guide_legend(
  title = NULL,
  reverse = FALSE,
  override.aes = NULL,
  nested = FALSE
)

guide_colourbar(
  title = NULL,
  barwidth = NULL,
  barheight = NULL,
  ticks = TRUE,
  ticks.colour = "white",
  label.position = NULL,
  n.breaks = NULL,
  reverse = FALSE
)

guide_colorbar(
  title = NULL,
  barwidth = NULL,
  barheight = NULL,
  ticks = TRUE,
  ticks.colour = "white",
  label.position = NULL,
  n.breaks = NULL,
  reverse = FALSE
)

guide_coloursteps(
  title = NULL,
  barwidth = NULL,
  barheight = NULL,
  ticks = FALSE,
  ticks.colour = "white",
  label.position = NULL,
  reverse = FALSE
)

guide_colorsteps(
  title = NULL,
  barwidth = NULL,
  barheight = NULL,
  ticks = FALSE,
  ticks.colour = "white",
  label.position = NULL,
  reverse = FALSE
)
Arguments
- plot
A PlotSpec.
- ...
Named by aesthetic, e.g.
guides(color = "none", shape = guide_legend(reverse = TRUE)).- title
An axis/legend title override, or
NULLto keep the default.- reverse
Reverse the order of the legend keys / the colour bar.
- override.aes
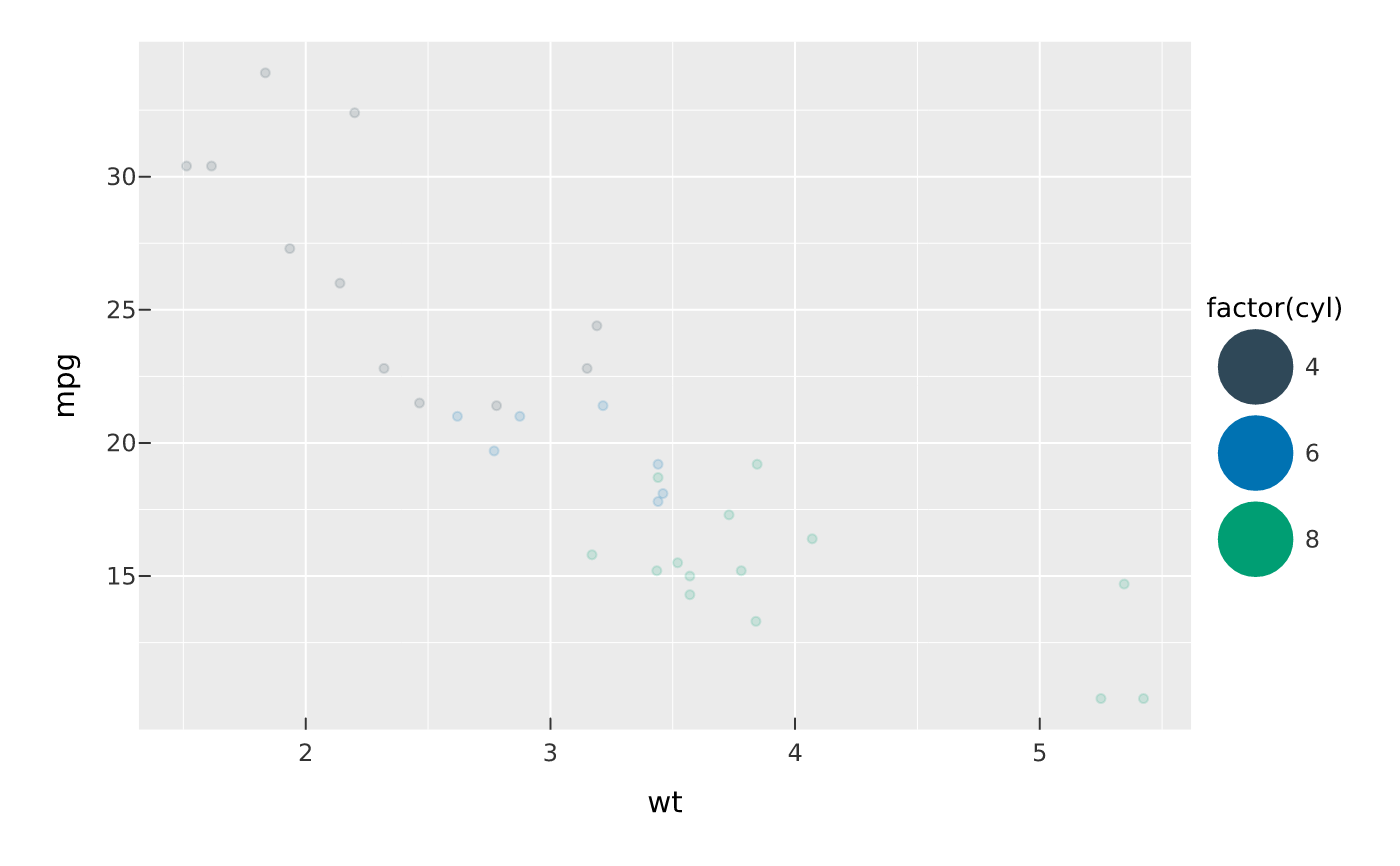
A named list of aesthetics to force on the legend keys, independent of the plotted data — the classic "make faint, small points legible in the key" fix. Recognised names:
size(mm),alpha,colour/color,fill,shape, andlinewidth. For exampleoverride.aes = list(size = 5, alpha = 1)draws big, opaque keys over a scatter of tiny translucent points.NULL(default) leaves the keys as drawn from the data.- nested
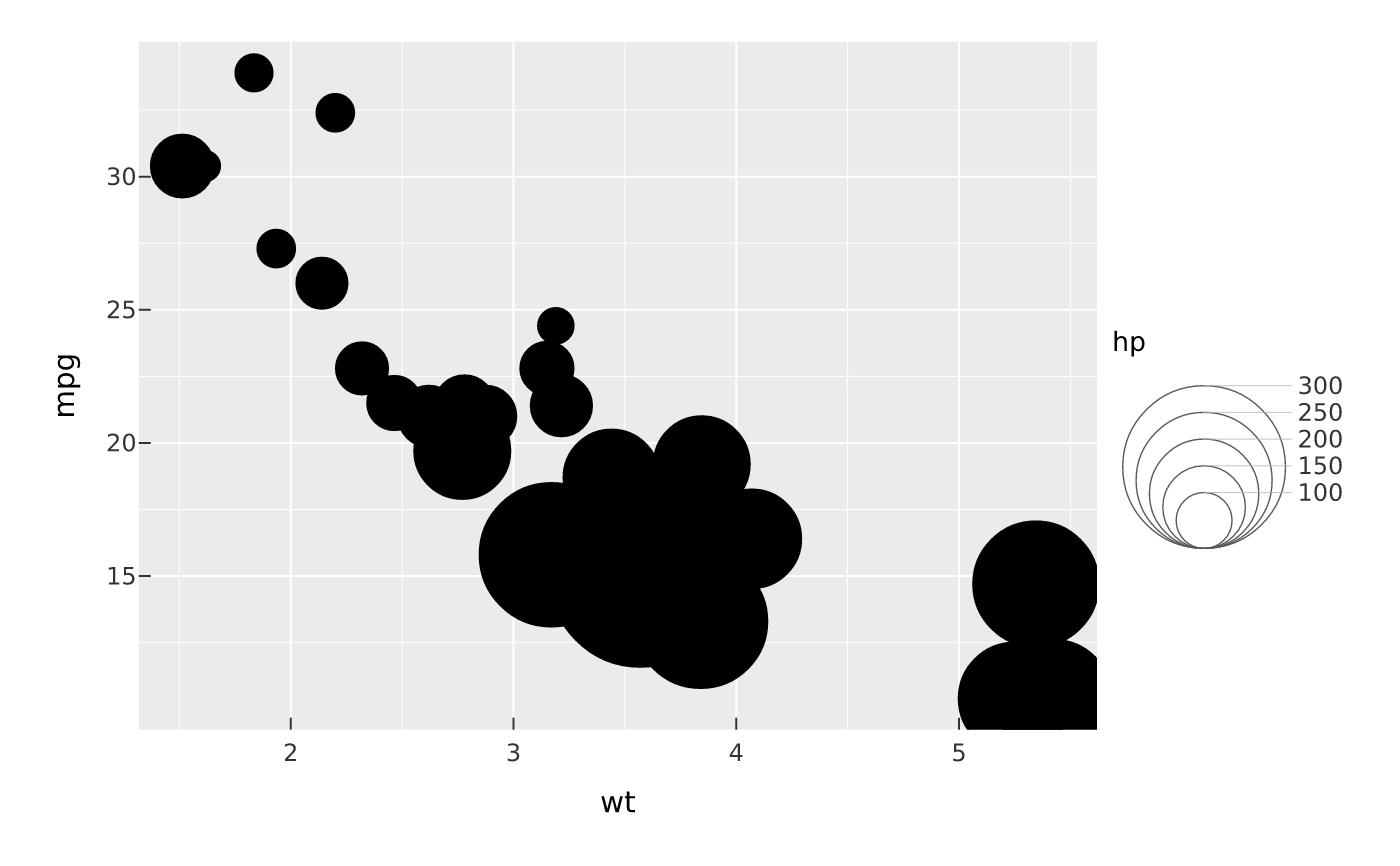
For a size legend, draw the keys as concentric, bottom-aligned circles (a proportional-symbol / "bubble" legend) with a leader from each circle to its label, instead of stacked rows. Best with a wide size range (e.g.
scale_size(range = c(2, 12))) so the circles are large enough to read; ignored by non-size legends. Drawn for a vertical legend (a horizontal one keeps the stacked keys).- barwidth, barheight
The colour bar's own width and height, in millimetres (
guide_colourbar()).barheightsets the bar's length on the default vertical bar (and its thickness on a horizontal one);barwidthits thickness (and the bar length on a horizontal legend).NULLauto-sizes.- ticks
Draw the break ticks on the colour bar? (Default
TRUEforguide_colourbar(),FALSEfor the segmentedguide_coloursteps().)- ticks.colour
Colour of the break ticks (default
"white").- label.position
Which side of a vertical colour bar the labels sit,
"right"(default) or"left".- n.breaks
Roughly how many ticks (and labels) to put on a continuous colour bar — a target, not a promise: the break algorithm prefers round numbers over the bar's range and returns whatever count reads best near the one asked for, so
n.breaks = 4may draw 3 or 5 rather than tick a value like 23.33.NULL(default) keeps the automatic count. An explicitbreaks =on the scale names the values that get a tick and outranks this; so doeslabels =, which is paired with those breaks.There is deliberately no
nbinargument (ggplot2's band count for the gradient). The bar is drawn as one real gradient fill, not a stack of rectangles approximating one, so it has no bands to count; the segmented look isguide_coloursteps()on a binned scale, where the segments are the scale's own bins.
Value
guides(): the modified PlotSpec. guide_none() / guide_legend():
a guide specification for use inside guides().
Examples
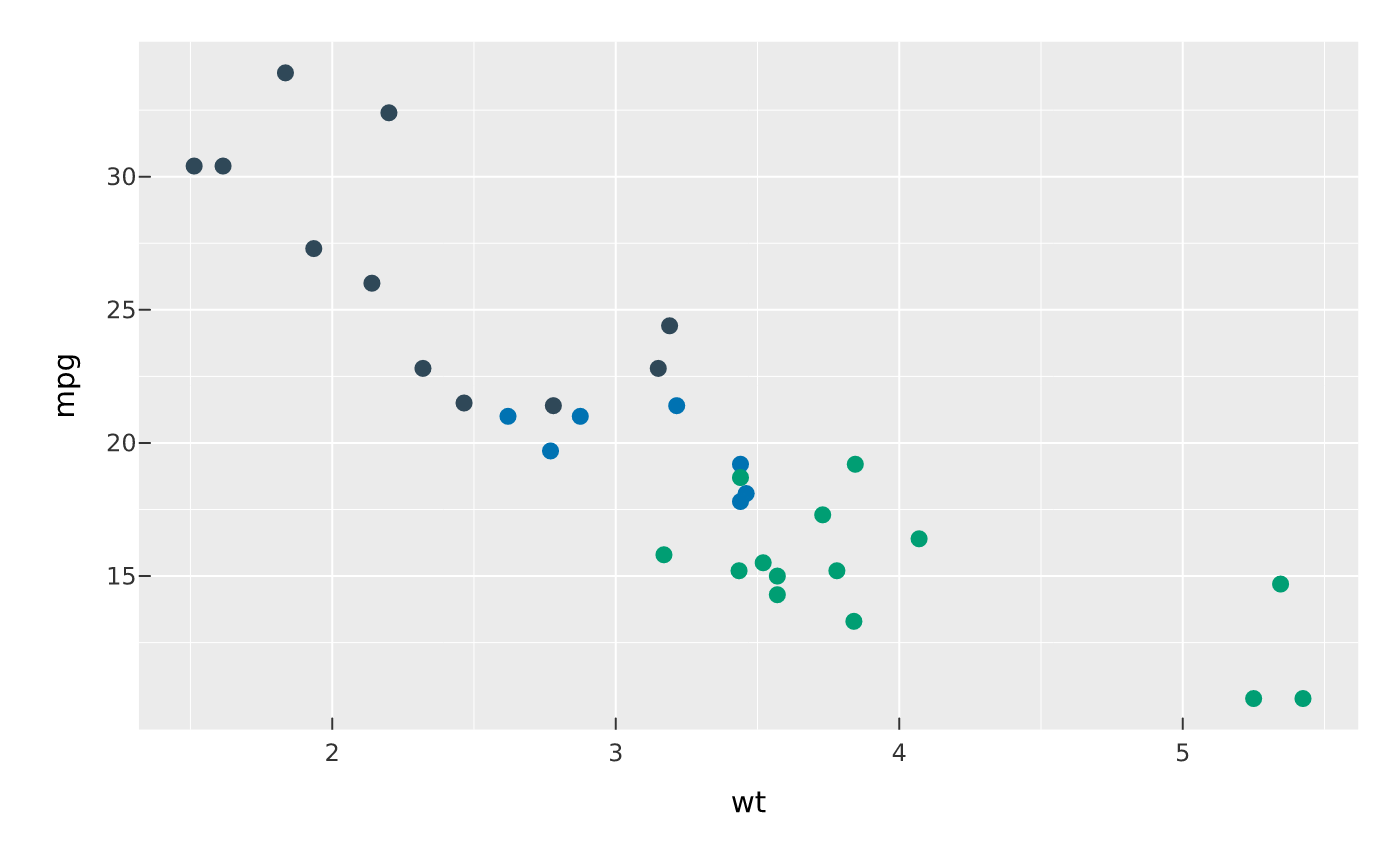
vplot(mtcars) |>
mark_point(x = wt, y = mpg, color = factor(cyl)) |>
guides(color = "none")
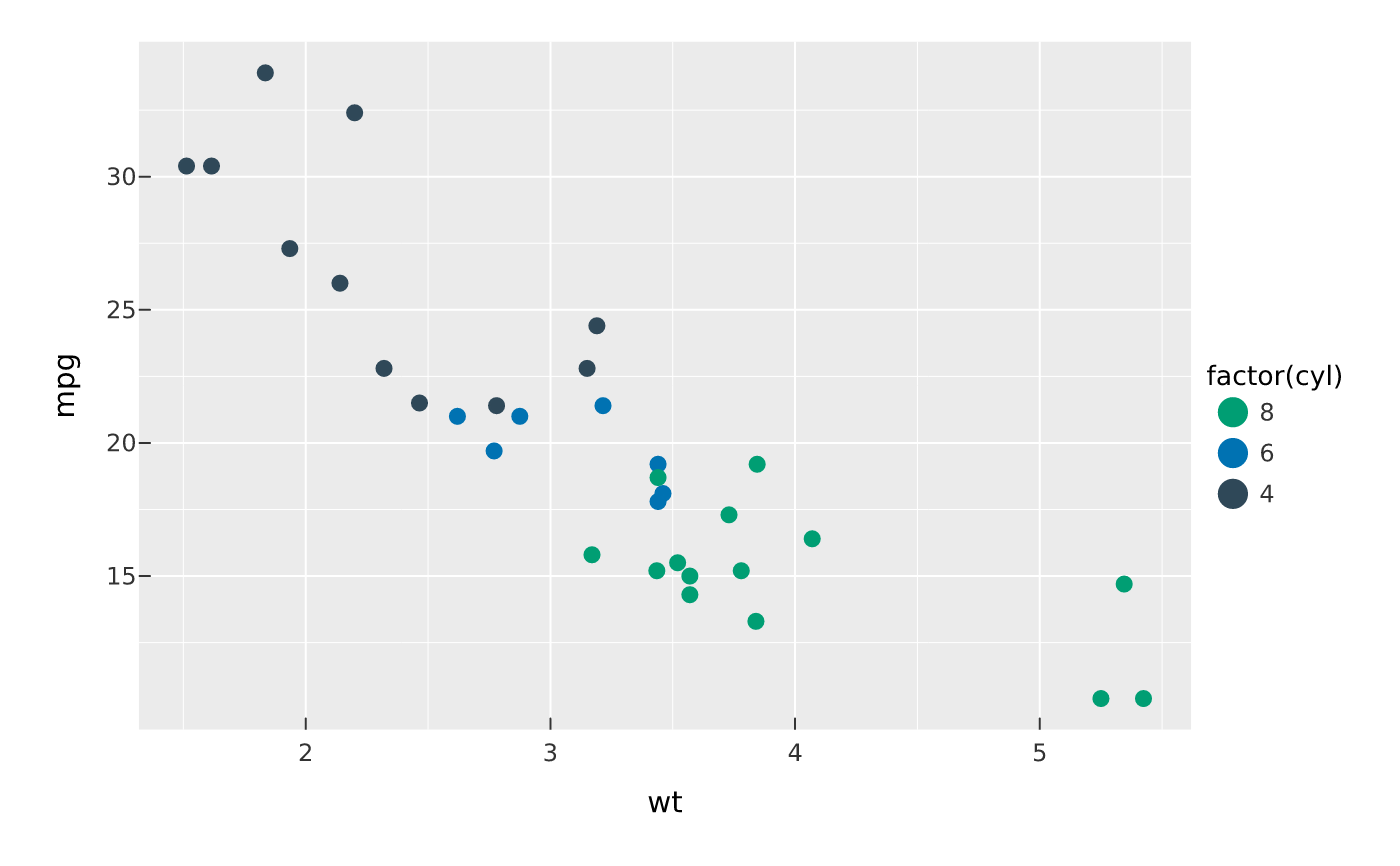
 vplot(mtcars) |>
mark_point(x = wt, y = mpg, color = factor(cyl)) |>
guides(color = guide_legend(reverse = TRUE))
vplot(mtcars) |>
mark_point(x = wt, y = mpg, color = factor(cyl)) |>
guides(color = guide_legend(reverse = TRUE))
 # legible keys over faint, tiny points
vplot(mtcars) |>
mark_point(x = wt, y = mpg, color = factor(cyl), alpha = 0.15, size = 0.6) |>
guides(color = guide_legend(override.aes = list(size = 5, alpha = 1)))
# legible keys over faint, tiny points
vplot(mtcars) |>
mark_point(x = wt, y = mpg, color = factor(cyl), alpha = 0.15, size = 0.6) |>
guides(color = guide_legend(override.aes = list(size = 5, alpha = 1)))
 # a taller, wider colour bar with left-side labels and no ticks
vplot(mtcars) |>
mark_point(x = wt, y = mpg, color = hp) |>
guides(color = guide_colourbar(
barwidth = 8, barheight = 60, ticks = FALSE, label.position = "left"
))
# a taller, wider colour bar with left-side labels and no ticks
vplot(mtcars) |>
mark_point(x = wt, y = mpg, color = hp) |>
guides(color = guide_colourbar(
barwidth = 8, barheight = 60, ticks = FALSE, label.position = "left"
))
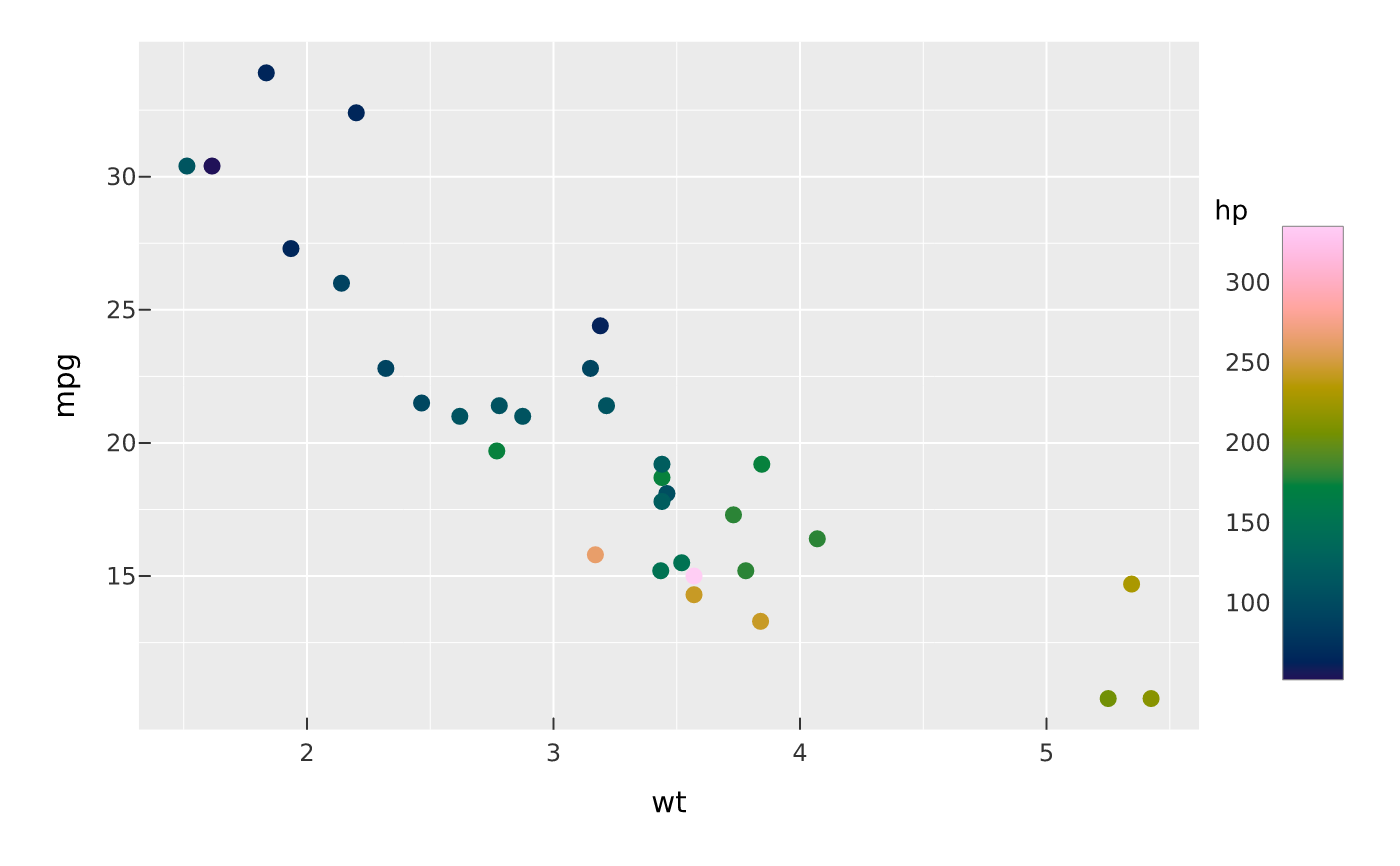 # about four ticks on the bar instead of the automatic count
vplot(mtcars) |>
mark_point(x = wt, y = mpg, color = hp) |>
guides(color = guide_colourbar(n.breaks = 4))
# about four ticks on the bar instead of the automatic count
vplot(mtcars) |>
mark_point(x = wt, y = mpg, color = hp) |>
guides(color = guide_colourbar(n.breaks = 4))
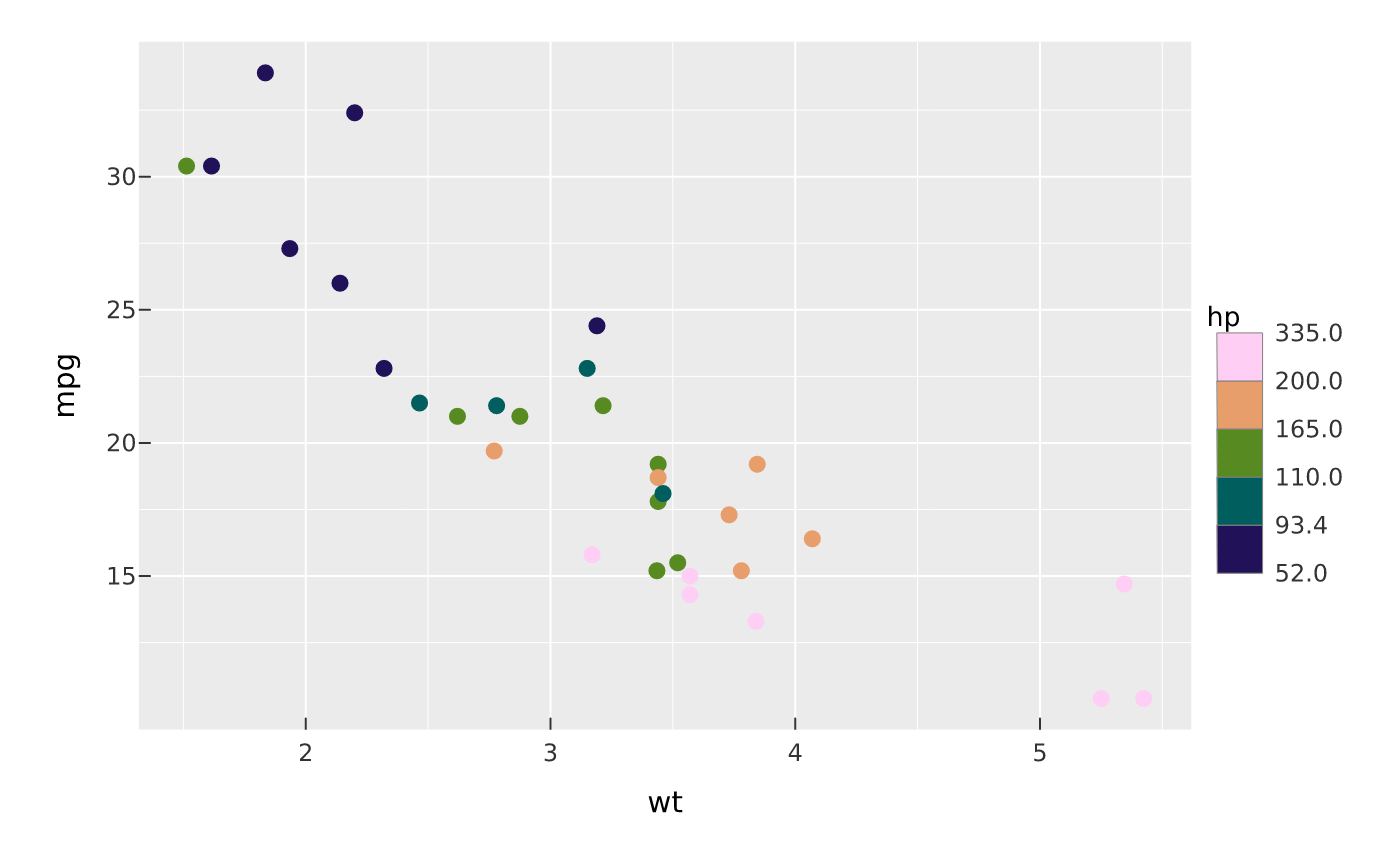 # a binned colour scale as a segmented bar
vplot(mtcars) |>
mark_point(x = wt, y = mpg, color = hp) |>
scale_color_binned() |>
guides(color = guide_coloursteps())
# a binned colour scale as a segmented bar
vplot(mtcars) |>
mark_point(x = wt, y = mpg, color = hp) |>
scale_color_binned() |>
guides(color = guide_coloursteps())
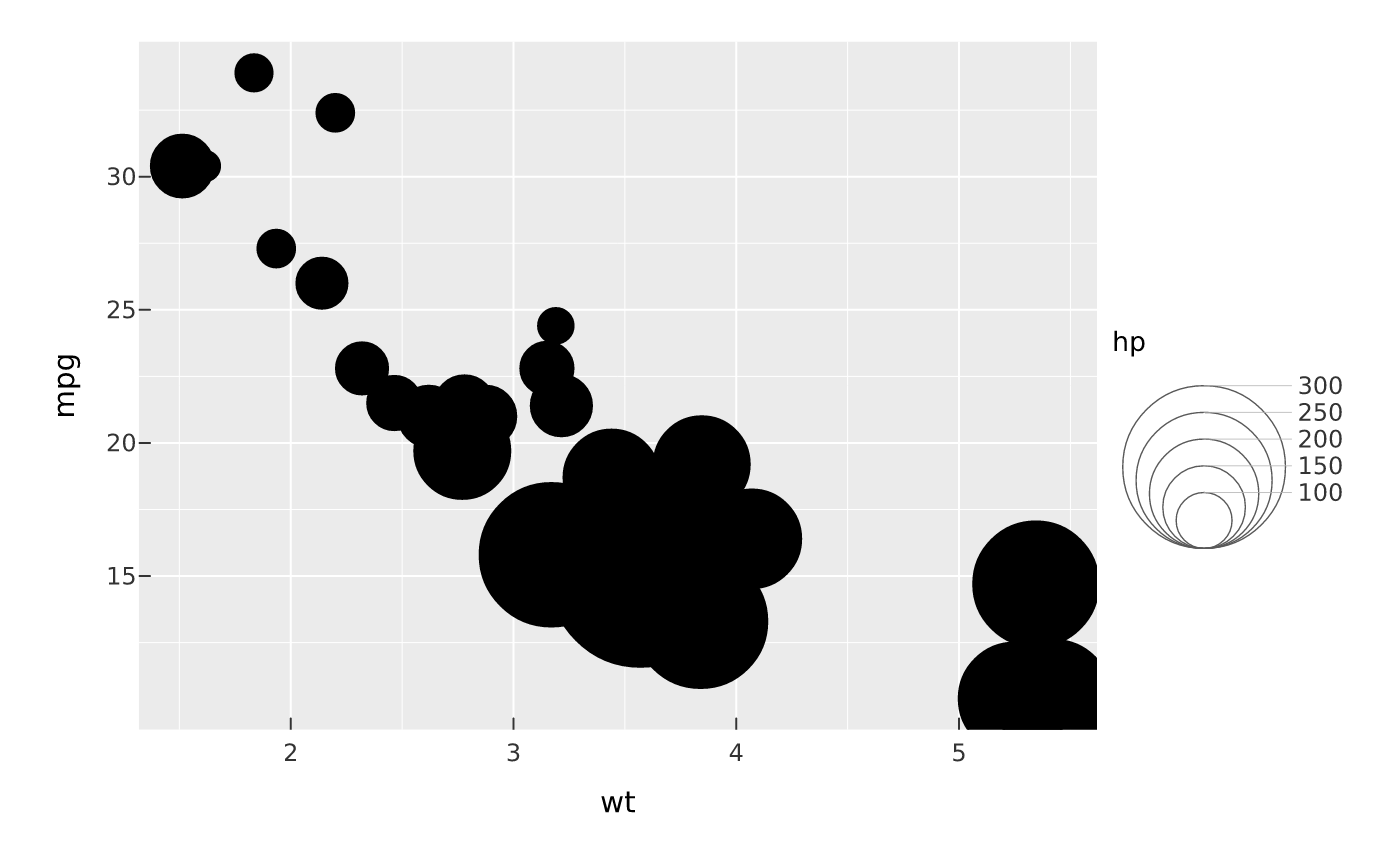 # a proportional-symbol (nested-circle) size legend
vplot(mtcars) |>
mark_point(x = wt, y = mpg, size = hp) |>
scale_size(range = c(2, 12)) |>
guides(size = guide_legend(nested = TRUE))
# a proportional-symbol (nested-circle) size legend
vplot(mtcars) |>
mark_point(x = wt, y = mpg, size = hp) |>
scale_size(range = c(2, 12)) |>
guides(size = guide_legend(nested = TRUE))