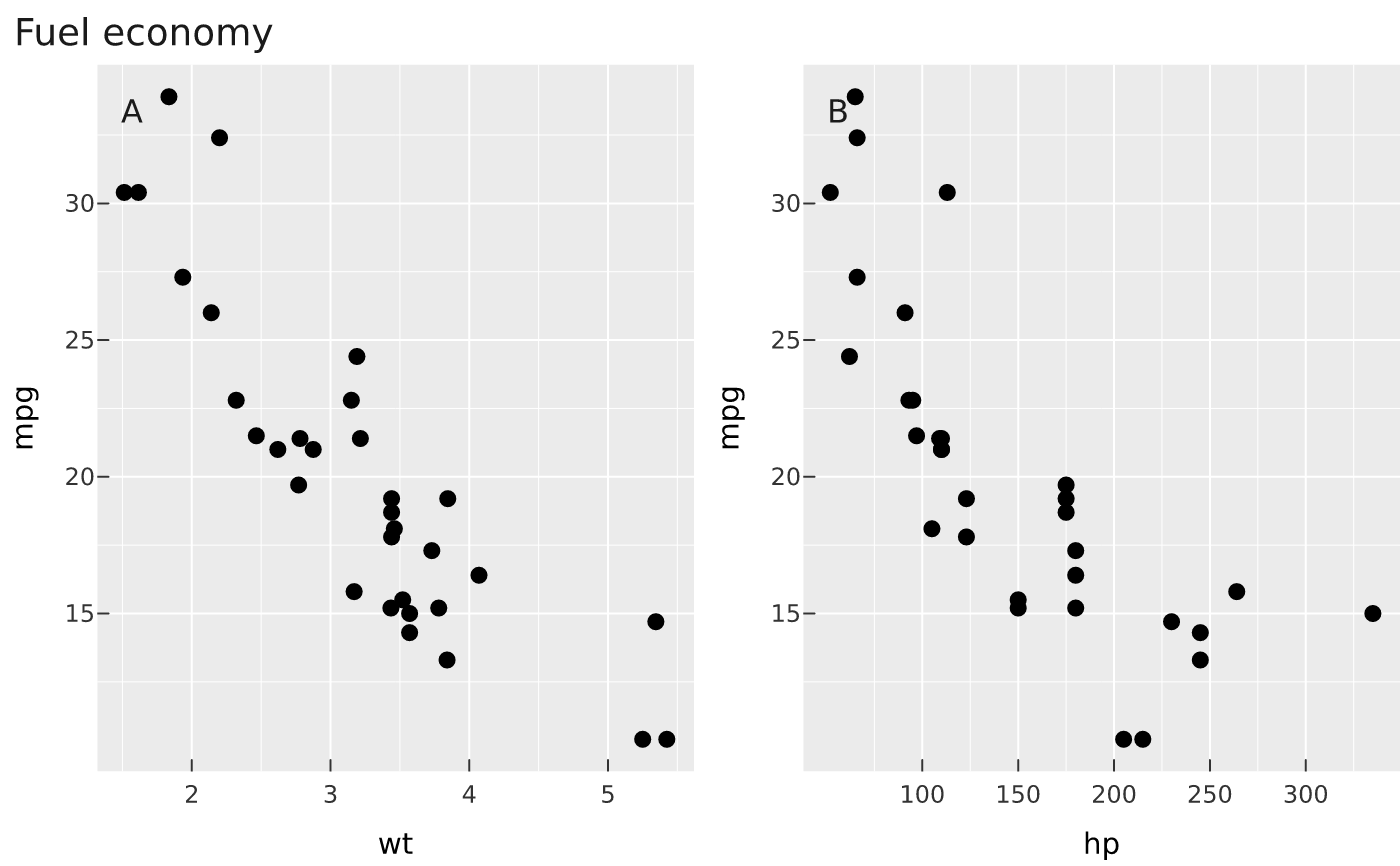
Add figure-level text (a title, subtitle, caption) spanning the whole
composition, and/or auto-tag the sub-plots (A, B, C, …). Because every
PlotComposition carries its own annotation, this works at any nesting level
(unlike patchwork, where annotation is top-level only).
Usage
compose_annotation(
  plot,
  title = NULL,
  subtitle = NULL,
  caption = NULL,
  tag_levels = NULL,
  tag_prefix = "",
  tag_suffix = ""
)See also
theme(), which also accepts a composition to set the figure-level
chrome (title bands, collected legend, panel spacing, tags).
Examples
a <- vplot(mtcars) |> mark_point(x = wt, y = mpg)
b <- vplot(mtcars) |> mark_point(x = hp, y = mpg)
hconcat(a, b) |> compose_annotation(title = "Fuel economy", tag_levels = "A")