
Skip to contents

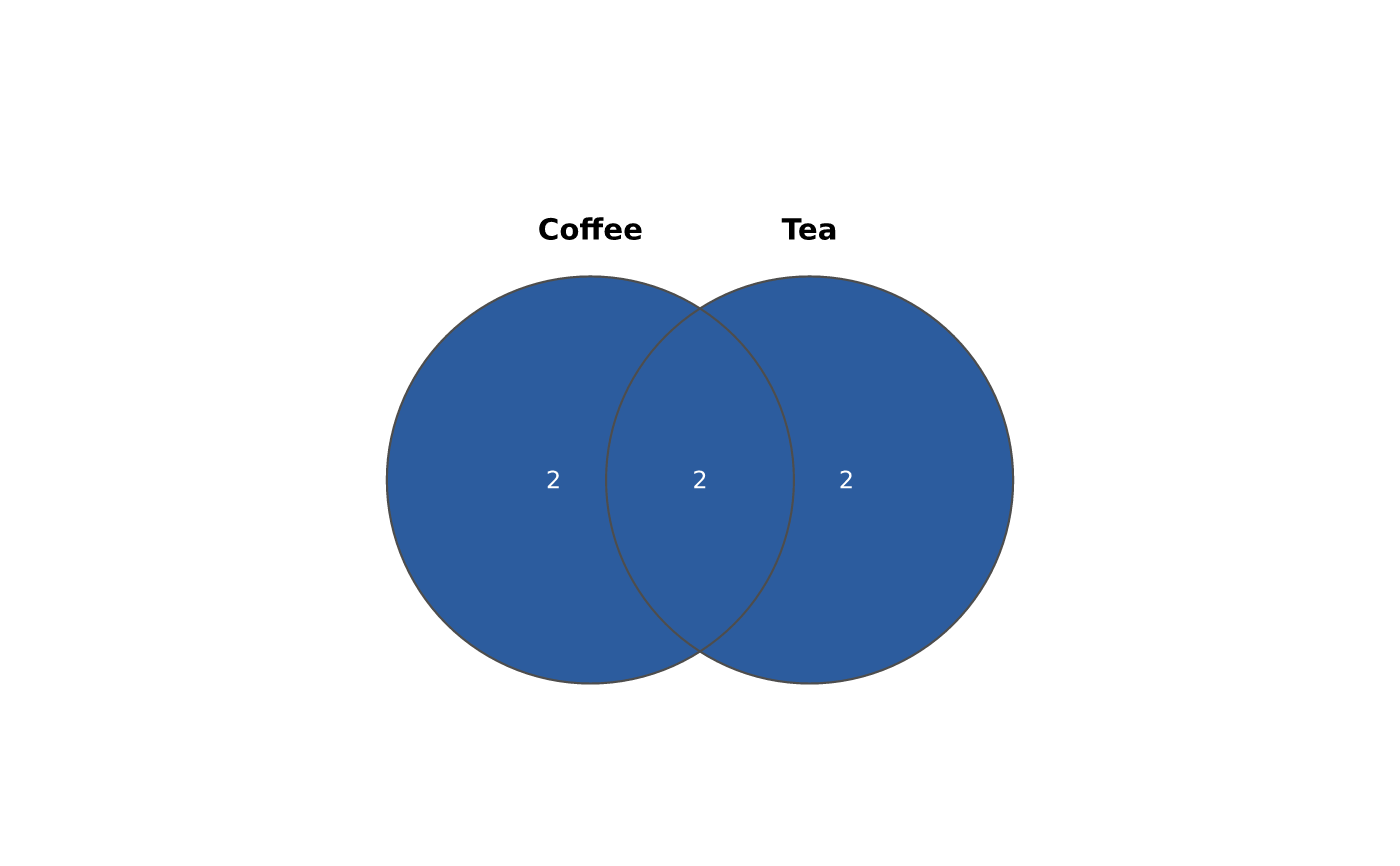
vvenn() draws a Venn diagram of 2 or 3 sets: overlapping circles whose disjoint regions are filled by how many elements fall in exactly that combination of sets. Each region is drawn as solid geometry (via vellum::vl_path_op()'s boolean set operations), so overlapping regions do not alpha-composite and stay crisp — including in PDF, where a rasterised mask would degrade.

Usage

vvenn(sets, width = 5, height = 5, dpi = 96)

Arguments

sets

Either a named list of member vectors (list(A = ..., B = ...)), or a data frame of logical membership columns (each column is a set; TRUE means that row is a member). 2 or 3 sets.

width, height, dpi

Figure size (inches) and resolution.

Value

A PlotSpec; print or render_plot() it.
Examples

vvenn(list(
  Coffee = c("Ann", "Bo", "Cy", "Di"),
  Tea = c("Bo", "Di", "Ed", "Fi")
))